0x (ZRXUSD) Is Struggling to Make an Impression at $1.200
Estimated Reading Time: 3 minutes
Don’t invest unless you’re prepared to lose all the money you invest. This is a high-risk investment and you are unlikely to be protected if something goes wrong. Take 2 minutes to learn more
Market Analysis – The $1.200 Resistance Level Keeps ZRXUSD Struggling to Break Above It
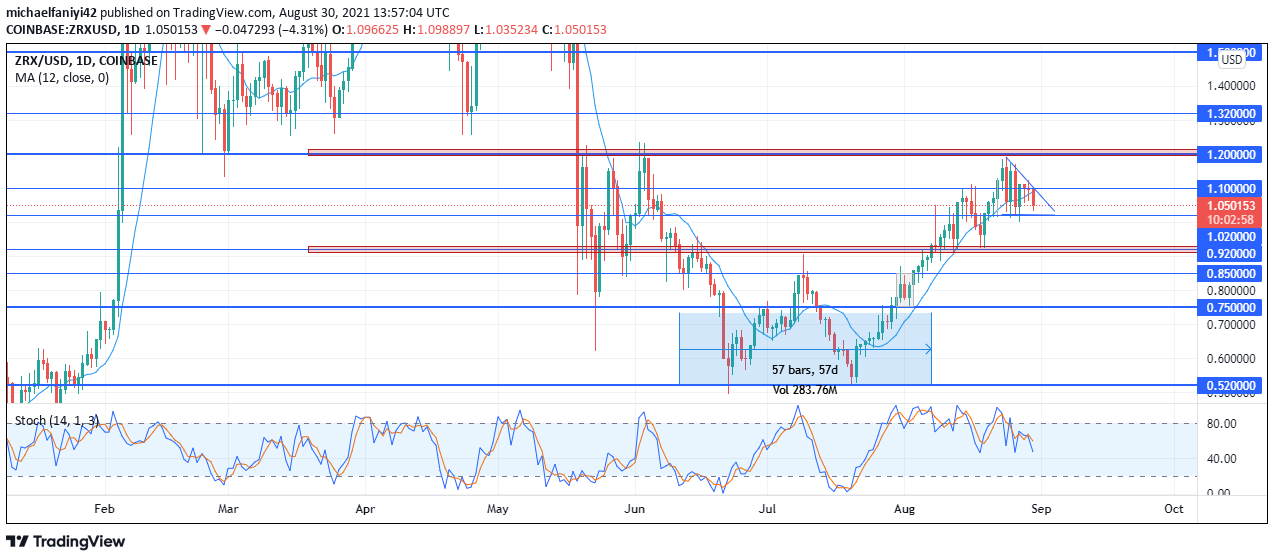
ZRXUSD is struggling after reaching above $1.100. The market’s impressive upward run has been repressed after ZRX is found struggling to get the better of the $1.200 key level. The first sign of a potential impediment came when the coin reached $1.100. Price had to retrace for a retest all the way back to $0.920 which pushed it past the resistance to reach $1.200 when bulls are now struggling to make further upward movement.
ZRXUSD Key Levels
Resistance Levels: $1.320, $1.200, $1.100
Support Levels: $1.020, $0.920, $0.850
The $1.200 is a prominent price level for ZRXUSD. It was responsible for impeding the ascent of price after the May 19 fall. It eventually aided the market’s decline to $0.920, another key level that first kept the market up, then confined it below. Price spent 57 days below $0.920 as a resistance before breaking above it on the 8th of August 2021. It was from this level, that price ascended to $1.100.
Having broken free of the $1.100 key level with a retest and break, the coin is now struggling to get any higher. At the time of writing, price has fallen again below $1. Despite the struggles of the coin, the Stochastic Oscillator depicts the market as still in the buying half of the chart and there is now a gradual decline in price and we can expect more of the same. The Moving Average period 12 has now moved above the daily candles to show market decline.

Market Prospects
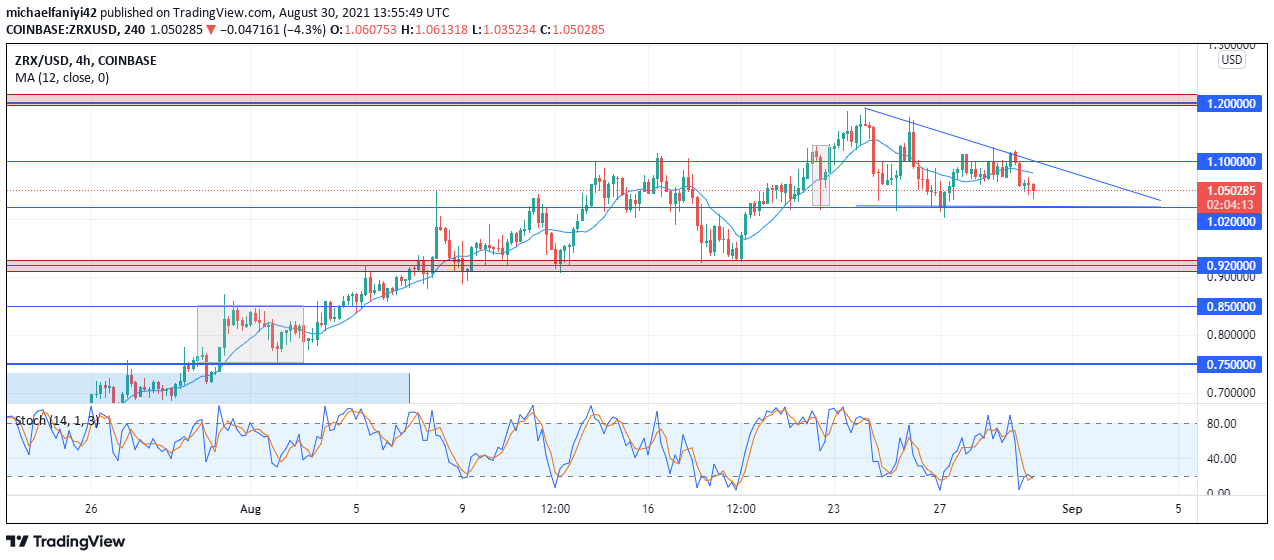
On the 4-hour chart, the coin is now tapering down a descending triangle. The breakout is most likely to the down side. The MA period 12 on the 4-hour chart is in accordance with that of the daily chart, it remains predominantly above the candles to drive it downwards. On the Stochastic Oscillator chart, price has dropped abruptly into the oversold region during the past 24hours.
We can expect to see more downside movement from the coin which is likely to touch down at $0.920 before further market reactions.
You can purchase crypto coins here: Buy Tokens
Note: Cryptosignal.org is not a financial advisor. Do your research before investing your funds in any financial asset or presented product or event. We are not responsible for your investing results.