0x (ZRXUSD) Remains Still at the Demand Zone
Estimated Reading Time: 2 minutes
Don’t invest unless you’re prepared to lose all the money you invest. This is a high-risk investment and you are unlikely to be protected if something goes wrong. Take 2 minutes to learn more
ZRXUSD Analysis – Market Remains Still at 0.550 Demand Zone
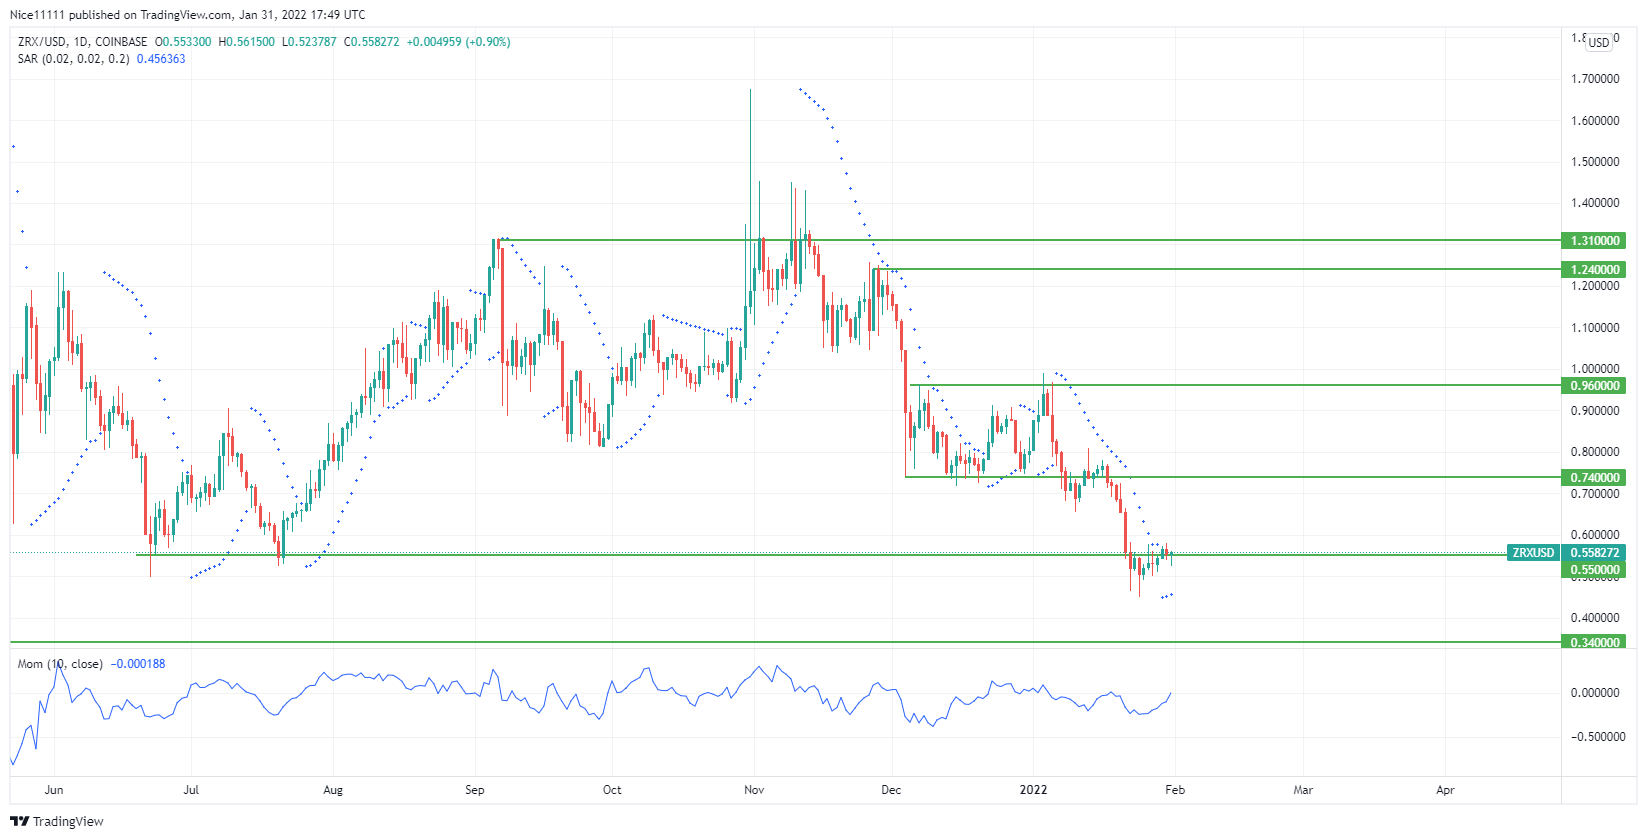
ZRXUSD remains still at the demand zone after lower pricing. The price of ZRX is currently at a deep discount. The bears have ruled the market since the reversal at $1.310. The bulls attempted a bullish run beyond the $1.320 zone multiple times. This is seen with long wicks above the zone. They failed multiple times as the bears took over. A double top was formed beneath the supply zone. While the wicks formed, the Parabolic Stop and reverse indicator revealed that the bulls were exhausted. The market has since then plunged into multiple demand zones. This is due to the selling pressure in the market.
ZRXUSD Major Zones:
Supply Zones: $1.310, $0.960, $0.240
Demand Zones: $0.740, $0.560, $0.340
The demand zone lows of $0.560 have currently been swept. After the reversal at the $1.310 zone in November 2021, the market consolidated before reaching the current demand zone. A sharp rejection was seen on the 4th of December, as the price reached $0.740. The market also experienced difficulties in reaching a higher price at $0.960. This created a range for ZRXUSD between the demand zone at $0.740 and the supply zone at $0.960.
The bears pulled through the zone as the price dropped to $0.550. The market has featured very little volatility in the past few days. The market remains still at the $0.550 demand zone. The $0.340 level lies beneath the $0.550 zone. This is likely to be an accumulation phase for anticipated volatile moves.

ZRXUSD Market Expectation
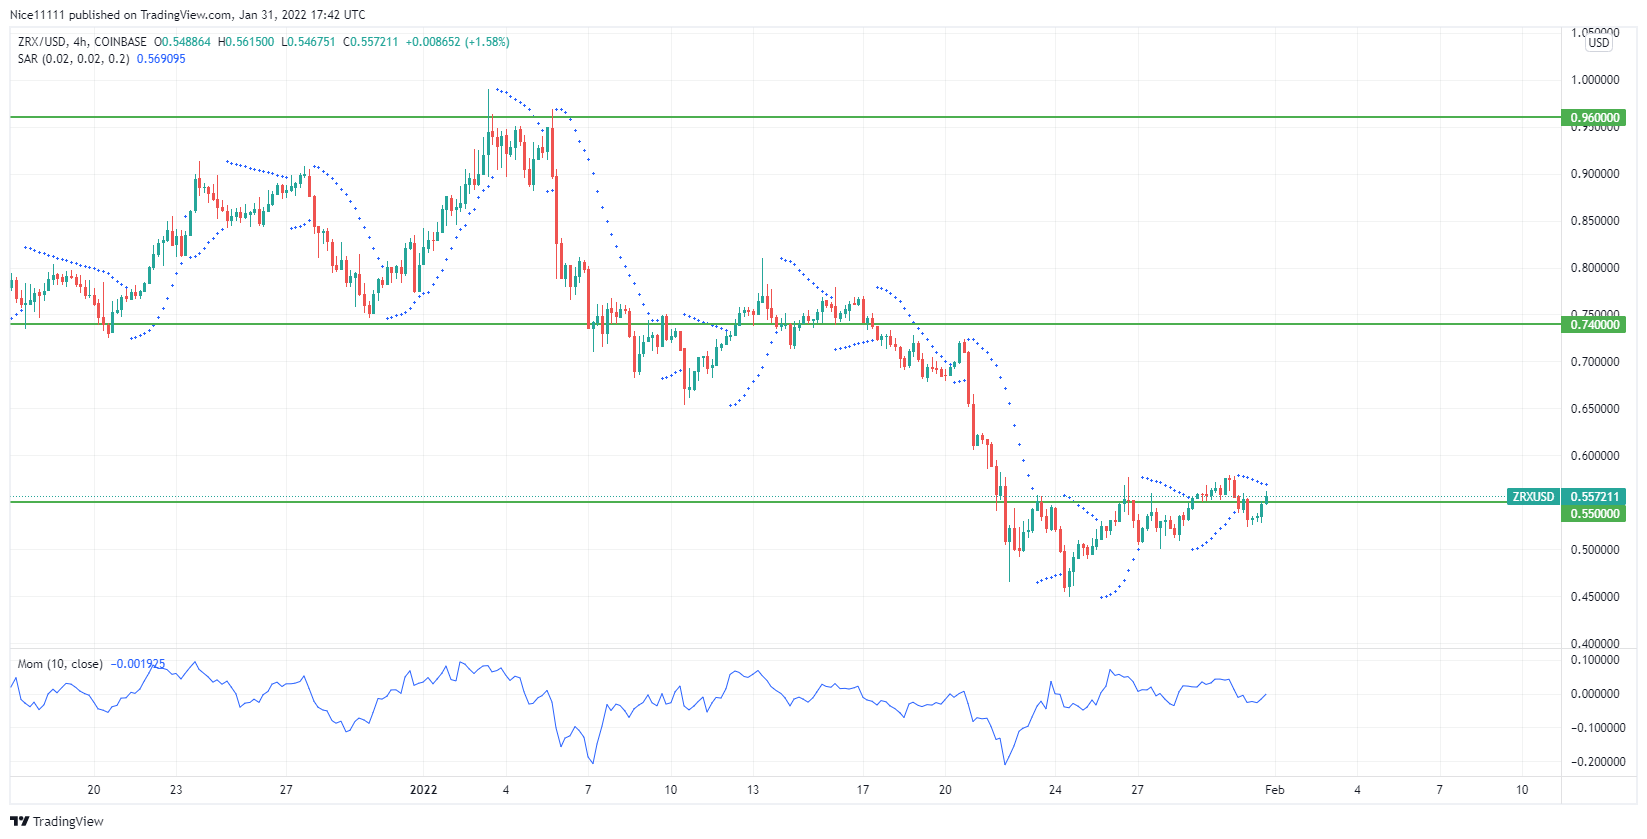
The market is seen to gyrate around $0.550 on the four-hour chart. The Parabolic SAR has donated almost equal points on both sides of the zone. The market remains still and decided as the bulls and bears are currently at breakeven. The momentum remains at the midpoint, showing equality between the buyers and sellers. The market could either rise to $0.740 or fall further to $0.340.
You can purchase crypto coins here: Buy Tokens
Note: Cryptosignals.org is not a financial advisor. Do your research before investing your funds in any financial asset or presented product or event. We are not responsible for your investing results.