0x (ZRXUSD) Seeks Lower Price Following Bullish Moment
Estimated Reading Time: 3 minutes
Don’t invest unless you’re prepared to lose all the money you invest. This is a high-risk investment and you are unlikely to be protected if something goes wrong. Take 2 minutes to learn more
ZRXUSD Analysis- Price Seeks Lower Price Around the $1.150 Significant Level
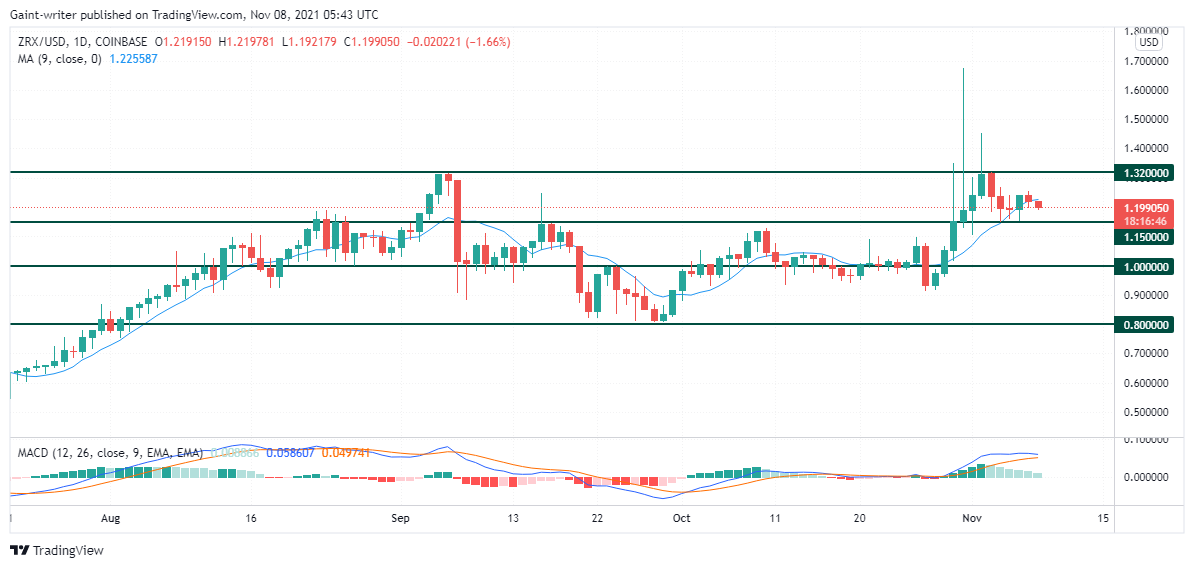
ZRXUSD seeks lower price levels following bullish moments to an old price level of $1.150. This market level has been tested to have held several price levels, and we, therefore, expect to see a market reaction at this level. The price will either break through to continue lower before making a u-turn or reverse due to price reactions at the key level. ZRXUSD being in a bull market seeks to attain a new height, but the bears in opposition eventually force the market down close to the $1.150 critical level.
ZRXUSD Important Zones:
Supply Levels: $1.320, $1.150
Demand Levels: $1.000, $0.800
ZRXUSD shows several bullish wick candlesticks breaking above the $1.320 critical level. This quick reaction came into play when buyers failed to attain enough strength to push the market upward. Sellers, notwithstanding, are still determined to reach $1.150 and may even drill beyond it. The bulls engaged in their first straight rally by breaking through the 0.800 zone before rising towards the $1.000 critical level. ZRXUSD proceeded upward to the $1.32 critical level before making a u-turn.
The coin has started to fall in a downward trend. Following the seller’s liquidity decline, the price returns to $1.000. ZRX, on the other hand, retested the $1.150 critical level before falling further to the $0.800 important level. As a result of a positive surge in price momentum, the coin is also observed reaching the $1.320 critical level. The market ultimately reached a substantial level, at which point we may notice price responses. The bears have already grabbed control of the coin, causing a pullback, as a result of the bulls’ failure to break above the $1.320 key barrier. On the daily chart, the MACD (Moving Average Convergence and Divergence indicator) still maintains a price indication in the positive range.

Market Prospects
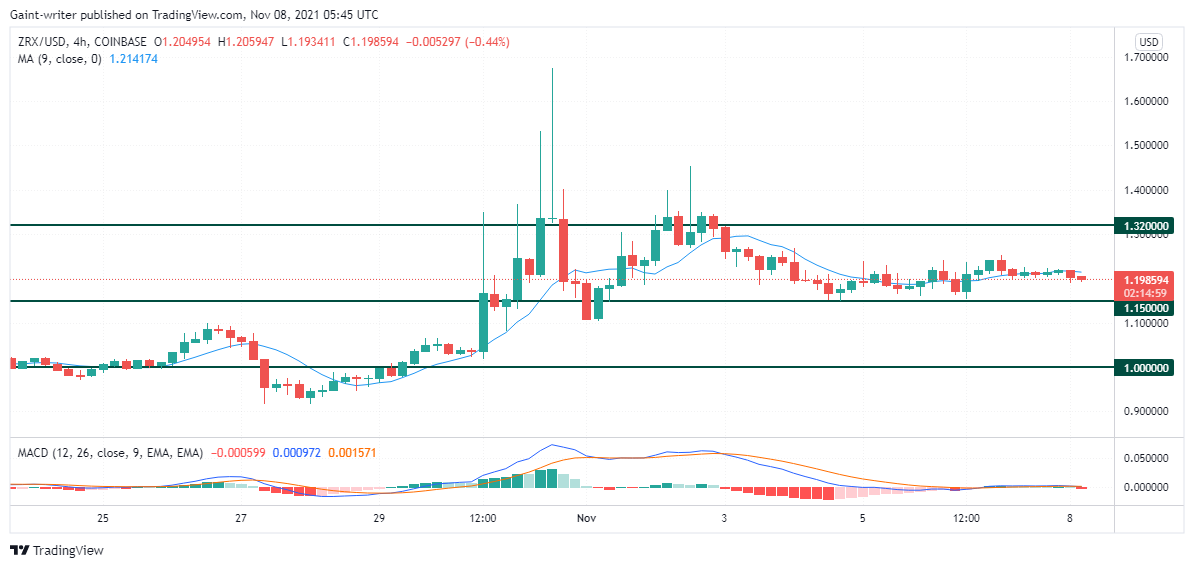
On the 4-hour chart, the coin is observed failing to break through with long wicks above the $1.320 critical level. ZRXUSD however, retested this level before continuing the range to go lower. ZRX is therefore expected to go lower to an important $1.150 zone before the bullish strength eventually continues. The price signal of the Moving Average shows the price acting as a resistance to the candles. The price mist, therefore, goes lower as the bears are still in control. The MACD on this chart is around the 0.00 level, but the market is anticipated to eventually continue its bullish ride after the pullback to the $1.320 critical level.
You can purchase crypto coins here: Buy Tokens
Note: Cryptosignals.org is not a financial advisor. Do your research before investing your funds in any financial asset or presented product or event. We are not responsible for your investing results.