3.700 Weekly Support Keeps BNTUSD Afloat
Estimated Reading Time: 3 minutes
Don’t invest unless you’re prepared to lose all the money you invest. This is a high-risk investment and you are unlikely to be protected if something goes wrong. Take 2 minutes to learn more
BNTUSD Analysis – Price Stays Afloat Through 3.700 Weekly Support
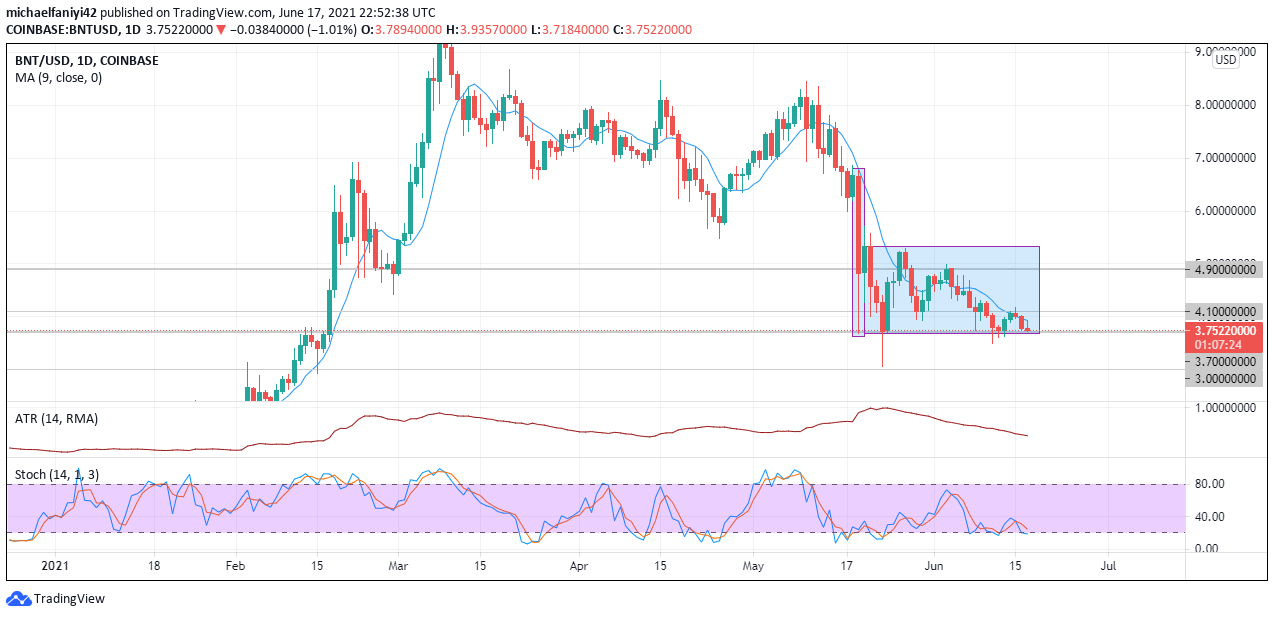
BNTUSD is relying heavily on the 3.700 weekly support to stay afloat. The market volatility has been on the decrease since the 24th of May 2021. This has coincided with a fall in the price of BNT.
The key levels have been very influential in directing the market. When the price fell heavily on the 19th of May, it was the 3.700 support that held the price up. Buyers tried to lift the market, but they got exhausted and the market fell again, this time to the 3.000 support where price met instant rejection upwards. Since then the 3.700 weekly support has been a bulwark to keep the coin afloat. However, bearish pressure has been mounting on the support and after holding the market up for 21 trading days, it has been breached three times in the last 7 trading days.
Currently, the BNTUSD is hovering above the 3.700 weekly support. The market is displaying a bearish candle. The 9 MA (Moving Average) on the daily chart remains above the candlesticks to shows bearish activities. The Average True Range indicator is at 0.486 and shows a plunging signal line, this shows dwindling market volatility. The Stochastic oscillator is afloat the oversold region and facing downward thereby signaling an imminent change in direction.
BNTUSD Key Levels
Resistance Zones: 4.900, 4.100
Supply Zones: 3.700, 3.000
Market Anticipation as BNTUSD Stays Afloat 3.700 Weekly Resistance
The sellers have generally been in control of the market, and it likely that the buyers will exploit any opportunity to take the market up. 
On the 4-hour chart, while the 9MA still shows the current bearish activities, the Stochastic indicator already shows that the market is likely to change direction soon. Its signal lines are already in the oversold region, and the blue line has its tip changing direction upwards.
The bulls are poised to take over the market and the price could rise as high to the 4.900 key level.
You can purchase crypto coins here. Buy Tokens
Note: Cryptosignal.org is not a financial advisor. Do your research before investing your funds in any financial asset or presented product or event. We are not responsible for your investing results.