Annual Forecast for Ethereum (2022) ETH/USD
Estimated Reading Time: 4 minutes
Don’t invest unless you’re prepared to lose all the money you invest. This is a high-risk investment and you are unlikely to be protected if something goes wrong. Take 2 minutes to learn more
Ethereum Annual Price Forecast
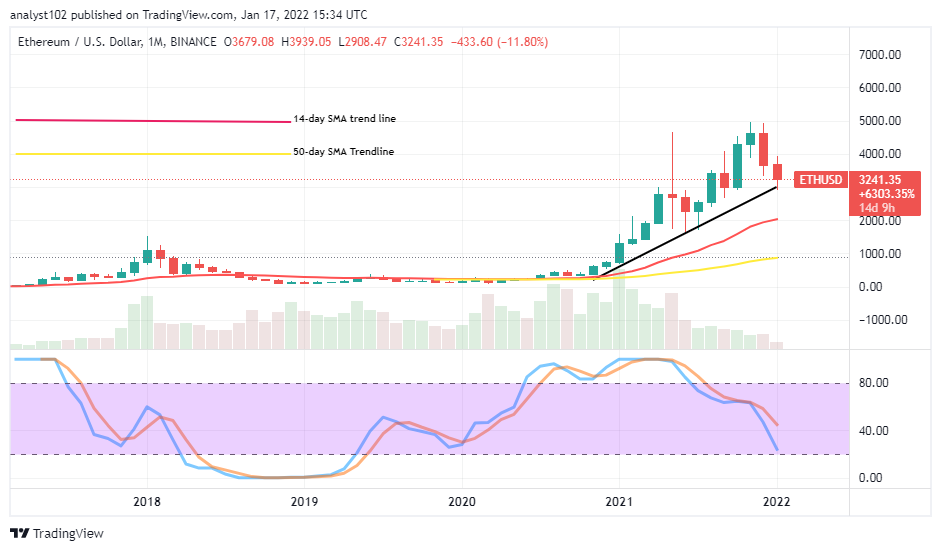
The ETH/USD annual forecast financial recording book shows that the market operations between the crypto coin and the US Dollar formerly experienced trading around $1000 line during the 2017 late sessions and lowered more significantly between 2018 and 2020. A couple of months before the 2021, the crypto-economic price begun to surge higher on the bullish threshold path to reach an all-time value line at $5,000 during the last year’s November operations. Since the beginning of this year the market has been trading between $3939 and $2908 lines at a percentage rate of about 11.80 negatives.
ETH/USD Market
Key Levels:
Resistance levels: $4,000, $4,500, $5,000
Support levels: $2,000, $1,500, $1,000
.
ETH/USD – Monthly Chart
The ETH/USD market annual forecast monthly chart showcases the crypto-economic price outpace the valuation of the US dollar more significantly since the start of the last year’s sessions until November. The December sessions turned out to bear a bearish candlestick, marking a start for the downward trading cycle expectantly to feature during some of the several months to come. However, the position of the indicators yet portend that much profits are still somewhat possessed in the crypto economy as the 14-day SMA indicator is above the 50-day SMA indicator. The bullish trend line drew over the SMAs to indicate that the crypto is yet to resort to an aggressive down turning process as traded with the US Dollar. The Stochastic Oscillators have slightly moved southbound closer to the range of 20. That signifies the crypto is systemically downing some of its profits as paired with the US currency.
Will there be a quick breakdown of the $3,000 as the ETH/USD annual forecast market has analyzed?
There may still be a series of downward price reverses around the $3,000 in the ETH/USD annual forecast market operations in the forthcoming months. The crypto trade appears to be giving in to the depression force on a lighter note that doesn’t allow traders to get or catch up with the bearish volatility index some of the other times when the moves occur. To spot a long entry position signal, traders would have to remain alert to observe when there will be a strong reversal of a downward motion below the value line mentioned earlier to exert a buying stance.
The downside of the ETH/USD market annual forecast analysis would require short-position takers to add more to their efforts in ensuring that the $3,000 level breached southward, making the bearish trend confirmation coming to reality. In other words, some pull-ups will be after achieving that presumption. And that is likely to allow price face resistances that will give back to sell entries. Lower levels around $2,000 or $1,500 can be revisited before the end of this year’s business operations at the expense of long-position takers’ weaknesses.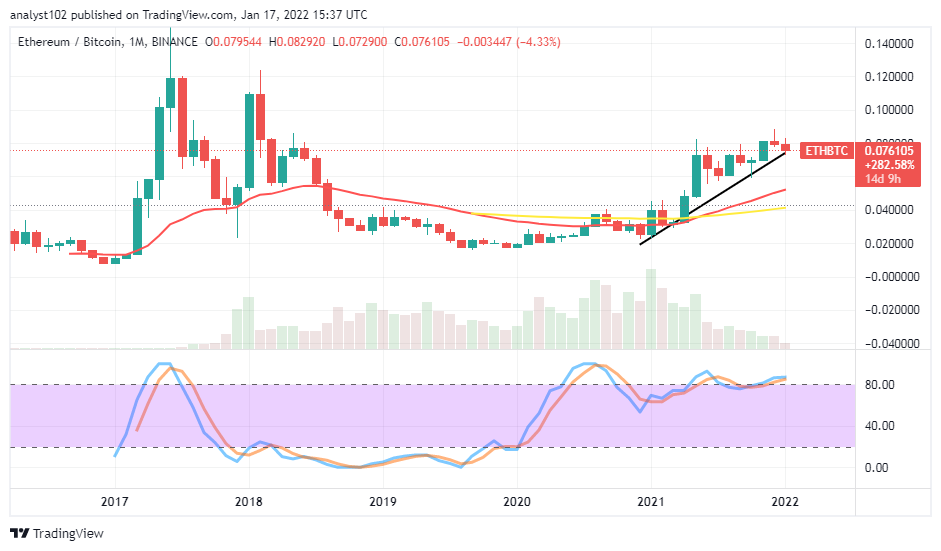
ETH/BTC Monthly Price Analysis
In comparison, the ETH/BTC market annual forecast monthly price analysis shows the cryptocurrency pair economy features far above the trend lines of the SMAs. There has been no significant downward signal on the crypto pair operations. The bullish trend line drew closely beneath the trading candlesticks to the north side over the SMA indicators. The 14-day SMA is above the 50-day SMA. The Stochastic Oscillators are moving in a consolidation around the range of 80 to indicate the base crypto still possesses stronger momentums against the flagship counter crypto. ETH may not lose tangible trending capacity to BTC in the following months to the extent of breaching the smaller SMA to the downside.
Note: Cryptosignals.org is not a financial advisor. Do your research before investing your funds in any financial asset or presented product or event. We are not responsible for your investing results.
You can purchase crypto coins here. Buy Tokens