Arbitrum Price Prediction: ARB/USD Turns Lower; Ready to Press Higher
Estimated Reading Time: 2 minutes
Don’t invest unless you’re prepared to lose all the money you invest. This is a high-risk investment and you are unlikely to be protected if something goes wrong. Take 2 minutes to learn more
Arbitrum Price Prediction – April 8
The Arbitrum price prediction would begin to form higher as the coin prepares to follow the bullish movement.
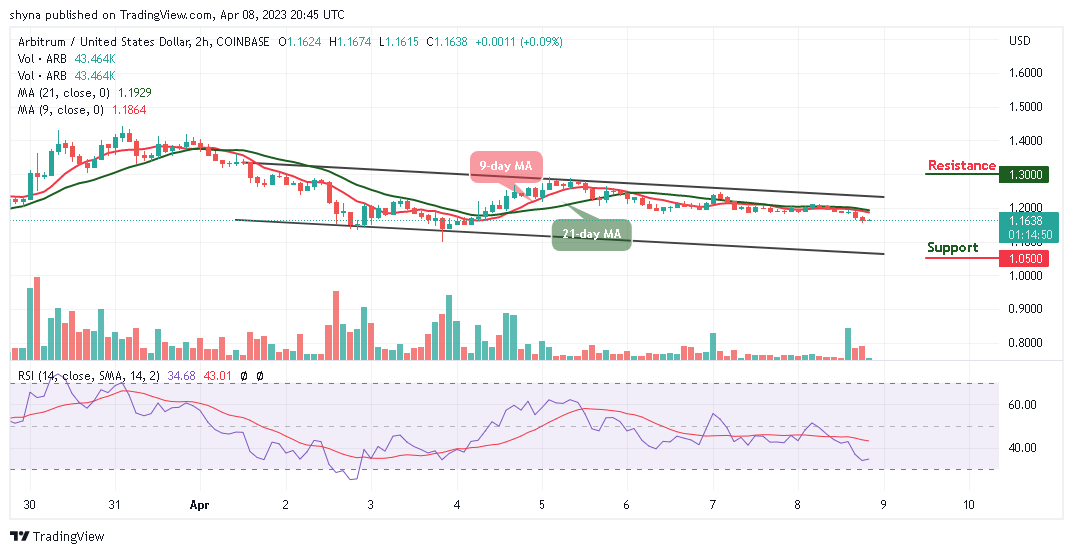
ARB/USD Medium-term Trend: Ranging (2H Chart)
Key Levels:
Resistance levels: $1.30, $1.35, $1.40
Support levels: $1.05, $1.00, $0.95
ARB/USD is sliding below the 9-day and 21-day moving averages as the coin heads toward the lower boundary of the channel. The market price is hovering at $1.16 and the Arbitrum price may retreat more to allow new investors to come into focus.
Arbitrum Price Prediction: ARB/USD May Break to the Upside
The Arbitrum price would begin to rise and break above the 9-day and 21-day moving averages as soon as the bulls defend the $1.16 level. However, any further bullish cross above the upper boundary of the channel may push the coin to the potential resistance levels of $1.30, $1.35, and $1.40.
In the meantime, this technical analysis may not play out now if the sellers increase the selling pressure, sliding toward the lower boundary of the channel will hit the support levels of $1.05, $1.00, and $0.95. Moreover, the technical indicator Relative Strength Index (14) is hovering below the 40-level to prepare the coin for the bullish movement in the next positive direction.
ARB/USD Medium-term Trend: Ranging (30M Chart)
Looking at the 30-minute chart, the Arbitrum price would move up higher if the coin crosses above the 9-day and 21-day moving averages. However, the long-term moving averages will begin the bullish movement as the market prepares for a new trend.
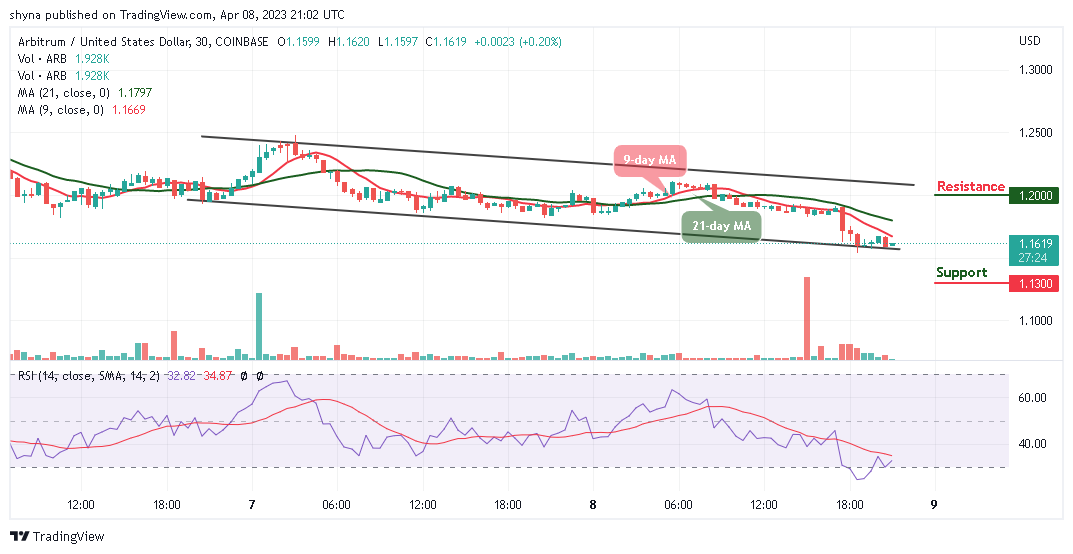
Therefore, if the buyers push the price above the moving averages, higher resistance could be reached at $1.20 and above as the technical indicator Relative Strength Index (14) recovers from the oversold region. Moreover, should the bulls fail to move the current market value above, the bears may step into the market, and the nearest support level could be located at $1.13 and below.