Bancor (BNTUSD) Bounces On an Ascending Trend Line to Go Up
Estimated Reading Time: 3 minutes
Don’t invest unless you’re prepared to lose all the money you invest. This is a high-risk investment and you are unlikely to be protected if something goes wrong. Take 2 minutes to learn more
BNTUSD Analysis – Bancor Bounces On an Ascending Trend Line and Is Set For More Upside
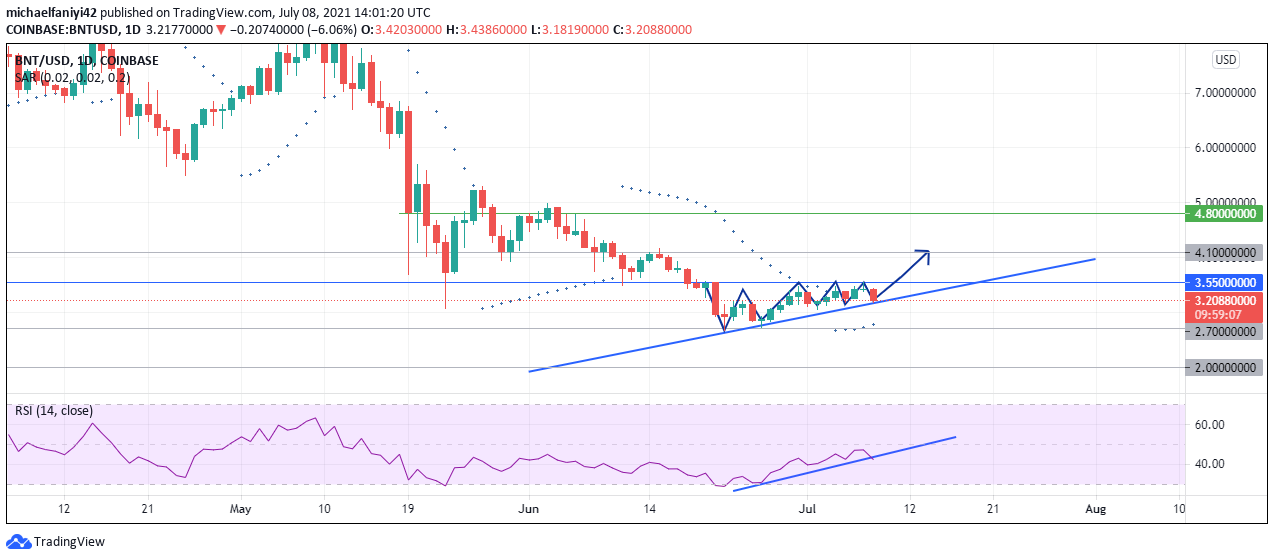
Bancor bounces on an ascending trend line to go higher. The market closed at $4.800 on the 19th of May 2021 after having a major fall in price. The $4.800 key level could not keep the market up for long and the market fell past the $4.100 and the $3.550 key level. The market rallied immediately and went above $4.800 again, but it fell immediately also and found support at $4.100.
The price remained supported by $4.100 for a while, till it fell below on the 11th of June 2021. It first fell to the $3.500 key level, then after failing to go up, fell further to $2.700. At this point, Bancor began to bounce upwards on an ascending trend line till it forms a triangle with the $2.700 key level.
The market is currently displaying a bearish candle that has struck the ascending trend line. The Parabolic SAR (Stop and Reverse) on the daily chart portrays the market as generally bullish. It has 5 dots aligned below the daily candlesticks. The RSI (Relative Strength Index) also models its signal line like the market’s movement. It is also undulating on an ascending trend line. The signal line is currently at 42.40.
Bancor Significant Levels
Resistance Levels: 4.100, 3.550
Support Levels: 2.700, 2.000
What to Expect As Bancor Bounces On an Ascending Trend Line
Bancor is seen moving up the trend line on the 4-hour chart. The trend line has coincided with $3.550 resistance to form an ascending triangle. The previous candle closed with a Doji candlestick which shows market indecision, then the current candle is bearish having struck the trend line.
The Parabolic SAR has presented four dots above the 4-hour candles. This is to reflect the current descent of the market to the trend line. The RSI also shows the same. The tip of its signal line has moved slightly forward.
Bancor is anticipated to bounce off the trend line and break through the $3.550 resistance to move towards the $4.100 key level.
You can purchase crypto coins here. Buy Tokens
Note: Cryptosignal.org is not a financial advisor. Do your research before investing your funds in any financial asset or presented product or event. We are not responsible for your investing results.