Bancor (BNTUSD) Bulls Step Out of Consolidation by Breaching the $4.400 Resistance
Estimated Reading Time: 3 minutes
Don’t invest unless you’re prepared to lose all the money you invest. This is a high-risk investment and you are unlikely to be protected if something goes wrong. Take 2 minutes to learn more
BNTUSD Analysis – Bulls Breach $4.400 to Step Out of a Ranging Pattern
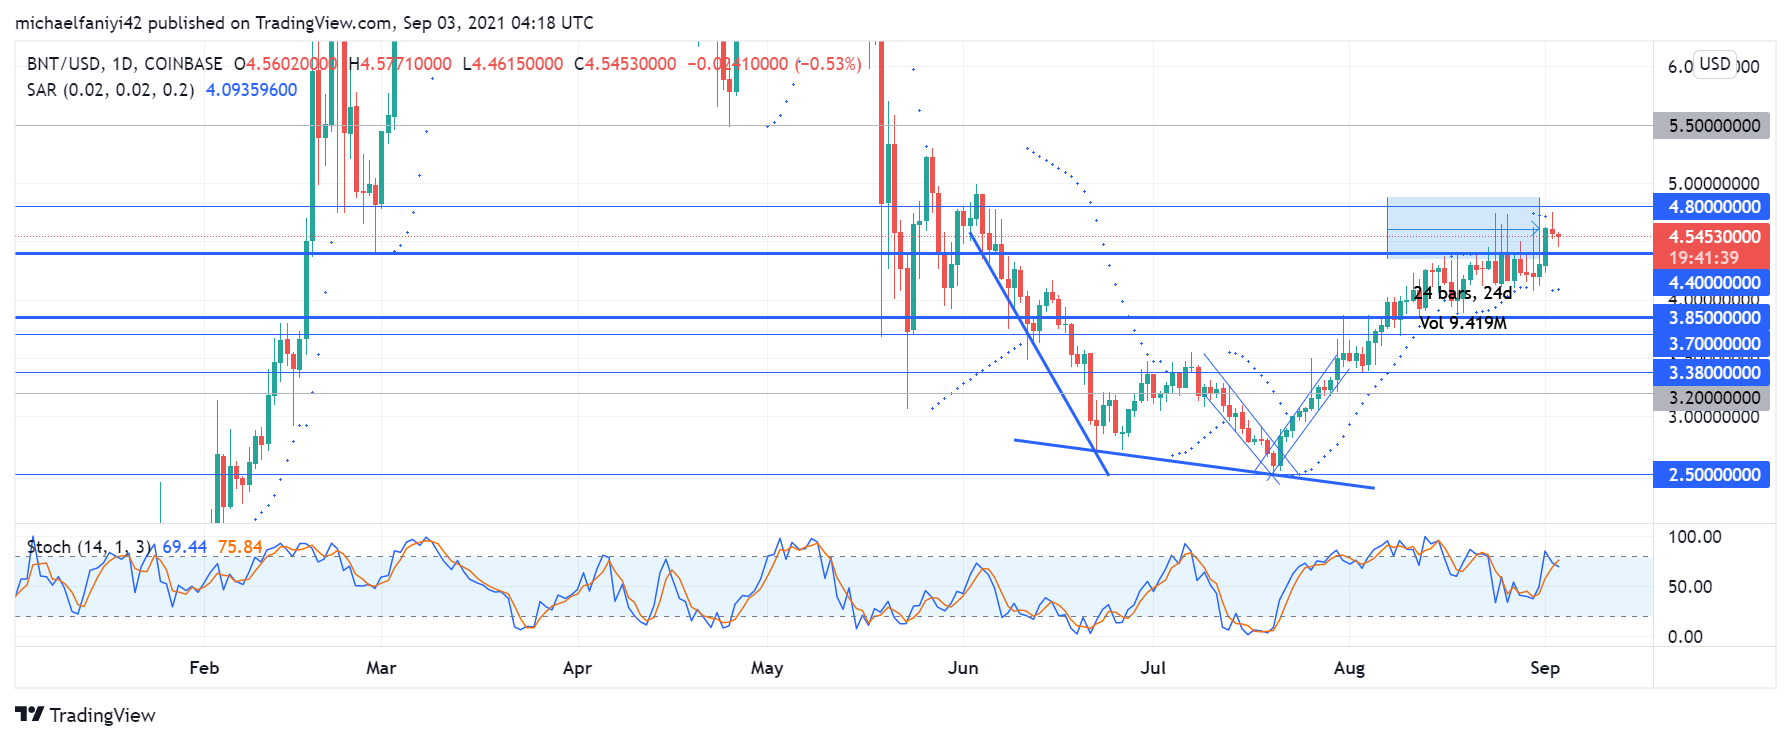
BNTUSD bulls step out of range movement to continue the upward trend. The market had been trapped between the $4.400 resistance level and the $3.850 support level for up to 24 days. This is the longest that the coin has been kept in confinement since it restarted its upward movement from the $2.500 key level on the 21st of July. The coin has now taken the first step towards breaking out of consolidation by breaching the $4.400 key level.
BNTUSD Key Zones
Resistance Levels: $4.400, $4.800
Support Levels: $3.850, $3.380
While confined in the consolidation zone, the bullish agitation of the coin is very visible. Even though the price was thoroughly defended at the resistance, the market kept making higher lows, even in consolidation. Several wicks of the candles can be seen to have drilled through the $4.400 resistance level. Essentially, it can be said that the coin moved up by springing from the consolidation support.
The market started making forceful moves on the 31st of August, and by the 1st of September, bulls were able to step out to break the $4.400 resistance level. Generally, the Parabolic SAR (Stop and Reverse) indicates a market with bullish vigor, hence it places more dots below than above the daily candles. The Stochastic Oscillator is seen to have recovered from a plunge to bounce off the 40 mark to approach the overbought region. Currently, there is a golden cross upwards by the signal lines and we can expect more bullish moves.

Market Expectations
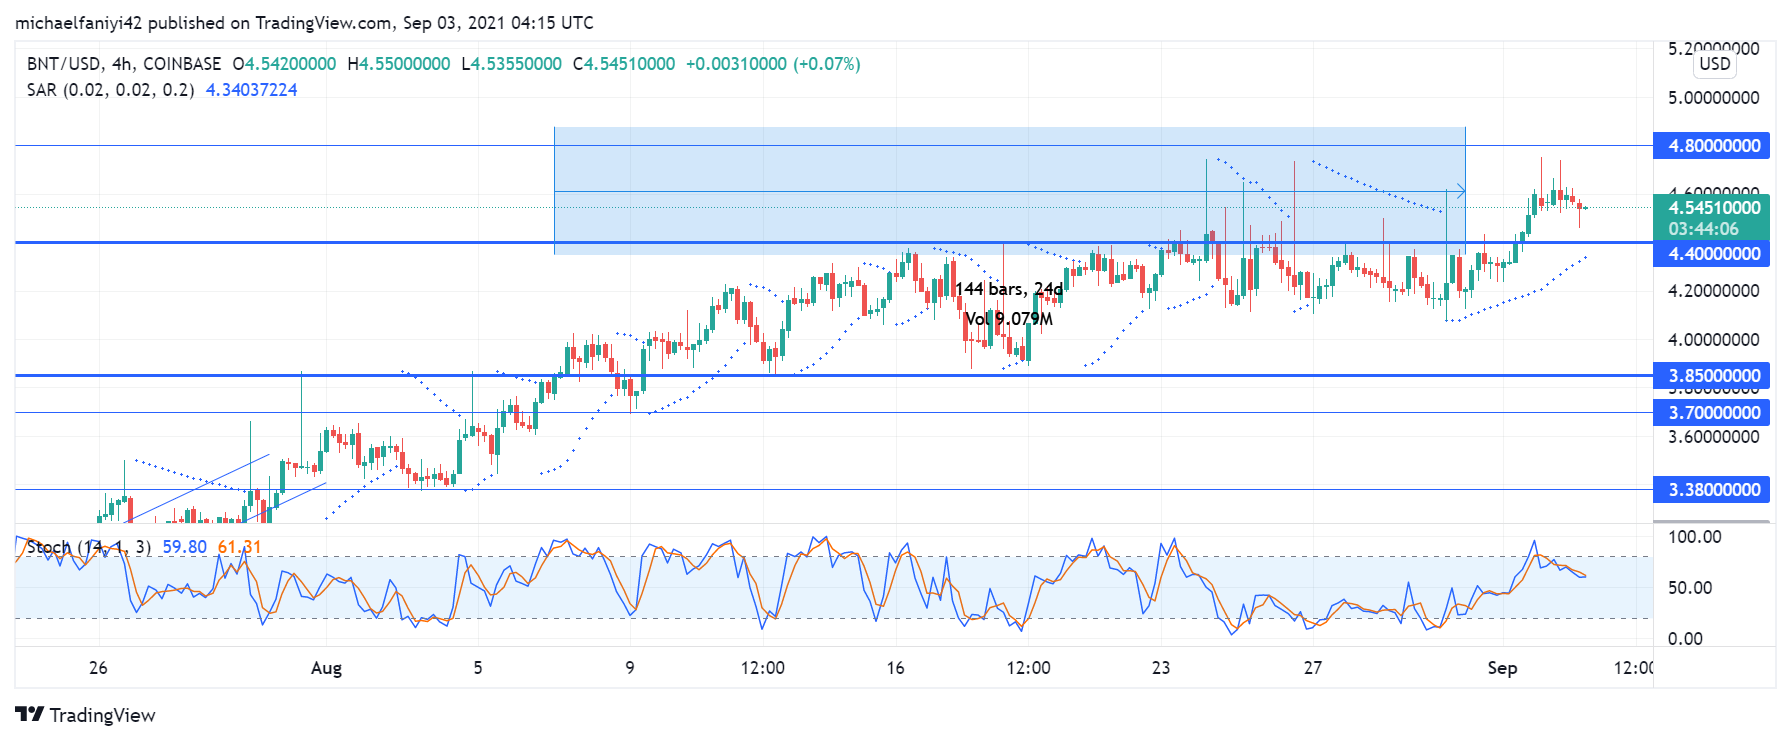
On the 4-hour chart, the market is pulling back from around the $4.800 key level for a retracement. Notwithstanding, the Parabolic SAR still attributes bullishness to the market in this 4-hour time frame by placing several dots below the market. The Stochastic Oscillator, however, is showing a drop in market momentum from the overbought region. This tells us that though the market is predominantly bearish, there is a reduction in the momentum of the bulls. Bears could step in to exploit this weakness and return the market back to consolidation below $4.400. However, we expect buyers to resume full activity.
The coin is expected to bounce off $4.400 and then move to $4.800.
You can purchase crypto coins here: Buy Tokens
Note: Cryptosignal.org is not a financial advisor. Do your research before investing your funds in any financial asset or presented product or event. We are not responsible for your investing results.