Bancor (BNTUSD) Faces Retracement After an Impulsive Move
Estimated Reading Time: 2 minutes
Don’t invest unless you’re prepared to lose all the money you invest. This is a high-risk investment and you are unlikely to be protected if something goes wrong. Take 2 minutes to learn more

Free Crypto Signals Channel
 Free Telegram Channel
BNTUSD Analysis the Market Faces Retracement After an Impulsive Move
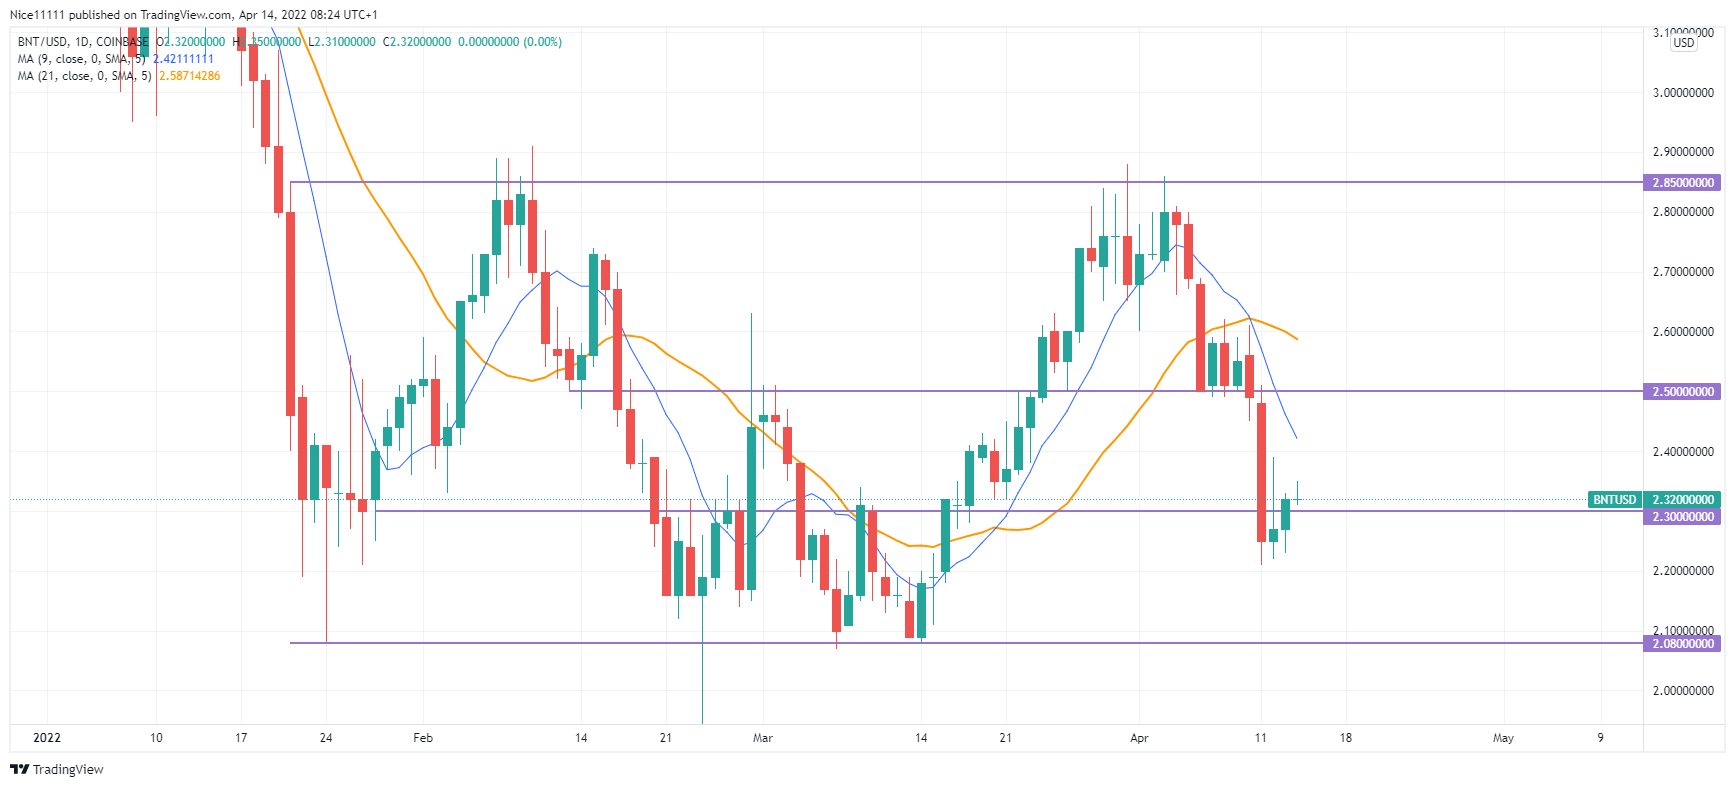
BNTUSD faces retracement after an impulsive move. The market dipped rapidly to $2.080. This caused the market to retrace its steps after the impulsive action. The retracement was a corrective move to mitigate the effect of the heavy selling pressure from the bears. The retracement was seized during February when the market reached the top of the gap caused by the impulsive move.
BNTUSD Major Zones
Resistance Zones: $2.850, $2.500
Support Zones: $2.300, $2.080
After the retracement level was struck, the market’s price action was very sloppy. The support level at $2.500 hindered the bearish run. With a shadow, the market dived to clear the previous low below $2.080. On February 24th, the market spiked beneath the demand zone. The market faced retracement after the impulsive move that cleared the previous low.
The demand level was tested again on the 7th of March. The market rallied up to $2.850. There were multiple wicks at the supply level. This was an early sign of a reversal. There was a structural market shift between $2.850 and $2.500. The bears were very heavy on the 6th of April. The daily bearish candle cleared the low at $2.500. The market did not experience any significant retracement after the first leg of the impulsive move.

BNTUSD Market Expectation
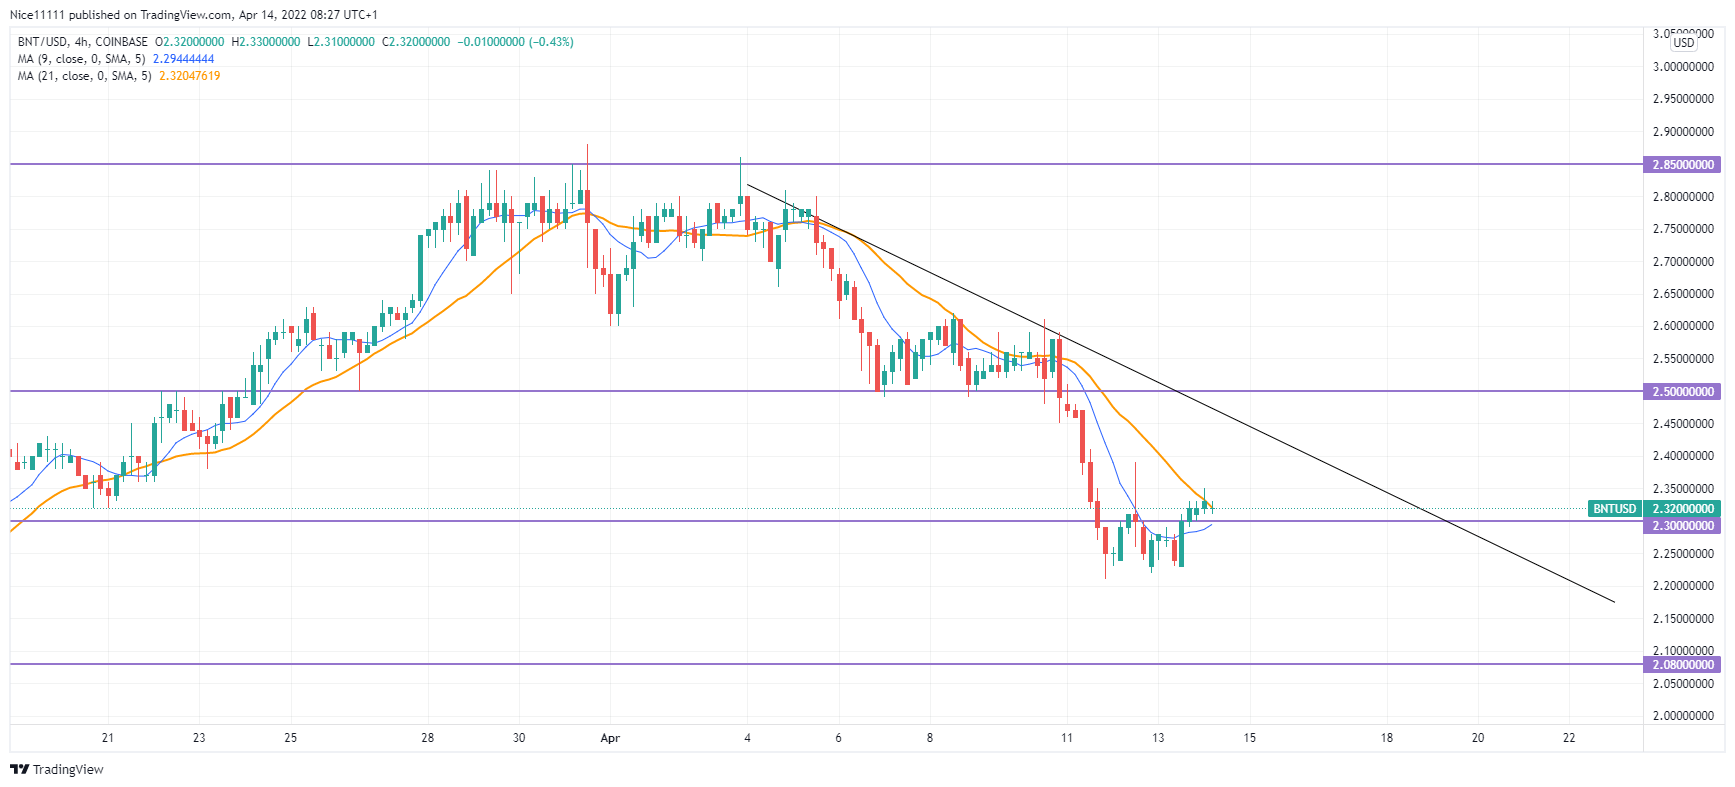
The market consolidated from the 7th to the 10th of April, after which there was another impulsive move. The demand zone at $2.300 was reached. The Moving Average periods nine and twenty-one have crossed to signify a bearish run. The market currently faces retracement after an impulsive move. Two small-sized bullish candles have formed in the last two days. The market is likely to go deeper into $2.080.
How To Buy Lucky Block
Note: Cryptosignals.org is not a financial advisor. Do your research before investing your funds in any financial asset or presented product or event. We are not responsible for your investing results.