Bancor (BNTUSD) Is Showing Multiple Reversal Signs After Bouncing off a Major Support Zone
Estimated Reading Time: 2 minutes
Don’t invest unless you’re prepared to lose all the money you invest. This is a high-risk investment and you are unlikely to be protected if something goes wrong. Take 2 minutes to learn more

BNTUSD Analysis – Price Is Showing Reversal Signs After Bouncing off $3.2550
BNTUSD is showing different signs that the bulls have invaded the market at a support zone. Bancor’s value has dropped continuously after the quarterly high was reached in November. The price dropped from the major resistance zone at $4.7850 to the major support zone at $3.2550. Some consolidation was noticed at $4.3650 when the bulls stepped in to pump the price but failed. The Moving Average and the Parabolic (SAR) Stop and Reverse indicators confirmed the change in trend.
BNTUSD Major Zones
Major Resistance Zones: $4.7850, $4.3650
Major Support Zones: $3.2550, $2.5750
The overall uptrend ended with the downward channel crossing the upward trendline. Since the major support zone was bounced on at $3.2550, “three white soldiers” were spotted on the daily chart. At the same time, it is seen that all the bearish candles that rest on the support zone have been violated. Multiple wicks are spotted just below the zone, showing where the price took off. The reversal signs are prominent even on the daily chart.
The Moving Averages periods 21 and 9 have crossed facing up as the candles are already bridging the upper border of the downward channel. On the daily chart, the Parabolic SAR has shown four points beneath the major support zone.

Market Anticipation
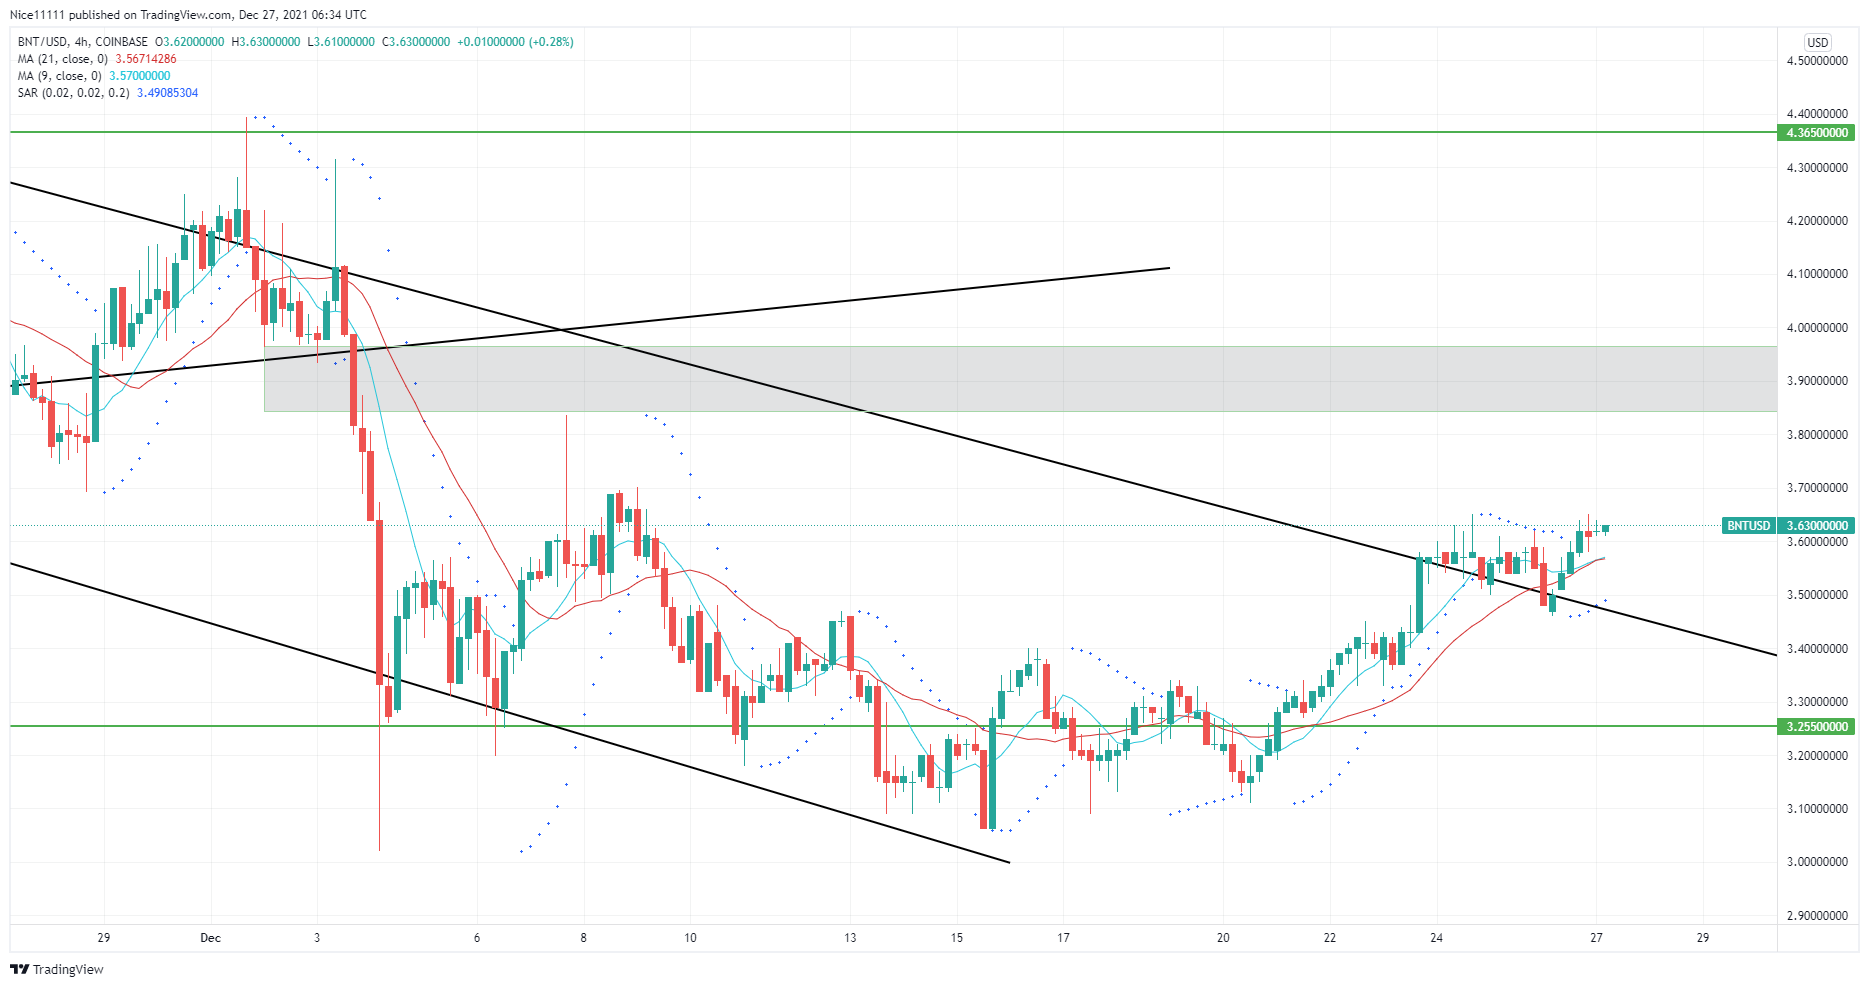
On the four-hour chart, an imbalance is prominent where the market is likely to draw up to. Sideway movement has been seen from the 13th to the 20th of this month. The bullish move, however, has been initiated with a series of bullish candles showing little opposition. The Parabolic SAR has points beneath the candles, showing bullishness. The 9 and 21 Moving Averages are also soaring in the direction of the next support zone at $4.3650.
You can purchase crypto coins here: Buy Tokens
Note: Cryptosignals.org is not a financial advisor. Do your research before investing your funds in any financial asset or presented product or event. We are not responsible for your investing results.