Bancor (BNTUSD) Makes a Successful Breakout in the Market
Estimated Reading Time: 3 minutes
Don’t invest unless you’re prepared to lose all the money you invest. This is a high-risk investment and you are unlikely to be protected if something goes wrong. Take 2 minutes to learn more

Free Crypto Signals Channel
Bancor Analysis – A Successful Breakout Is Seen in BNTUSD
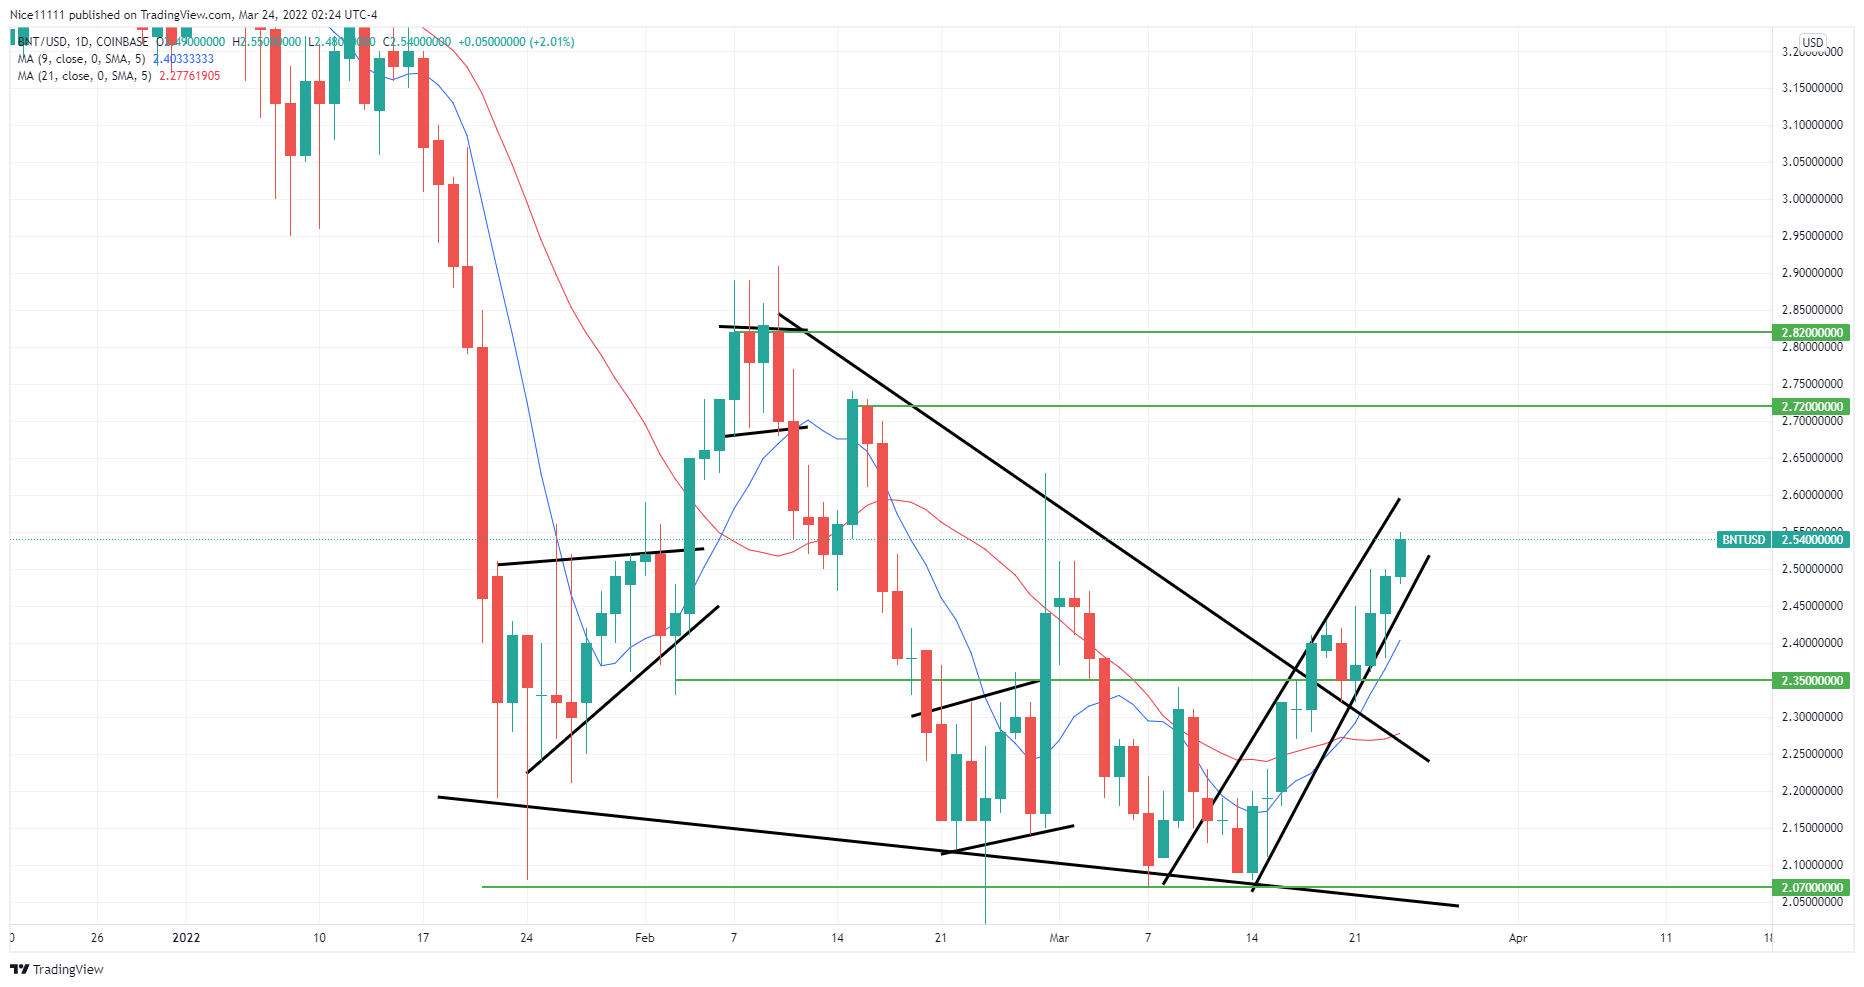
BNTUSD makes a successful breakout in the market. There was an impulsive move during the first month of the year, from the 17th to the 24th. There was a shadow below the daily candles on the 24th of January, which was a sign of rejection. An ascending triangle formed from January into February, followed by a successful breakout in the market. On the 4th of February, the successful breakout led the market straight into $2.820.
Significant Levels on BNTUSD
Resistance level: $2.820, $2.720
Support level: $2.350, $2.070
At the resistance zone of $2.820, multiple wicks lined up one after the other from the 7th of February till the 10th of February. Multiple attempts to bridge the resistance level failed. This caused a short-term consolidation in the market. A successful breakout from the range was experienced on the 11th of February. The market retraced to aid more sellers to get engaged in the market. A rapid fall dipped back into the demand zone at $2.070.
There was a shadow below the daily candles on the 24th of February, which was a sign of rejection. An ascending channel formed from the 21st of February till the 28th of February. This was followed by a successful breakout which tested the downward trend line. The trend line acted as a resistance against the bulls. The market has fallen back to the demand zone at $2.070. A double bottom formed in the demand zone. This triggered a surge of buying pressure in the market.

What to Expect From BNTUSD?
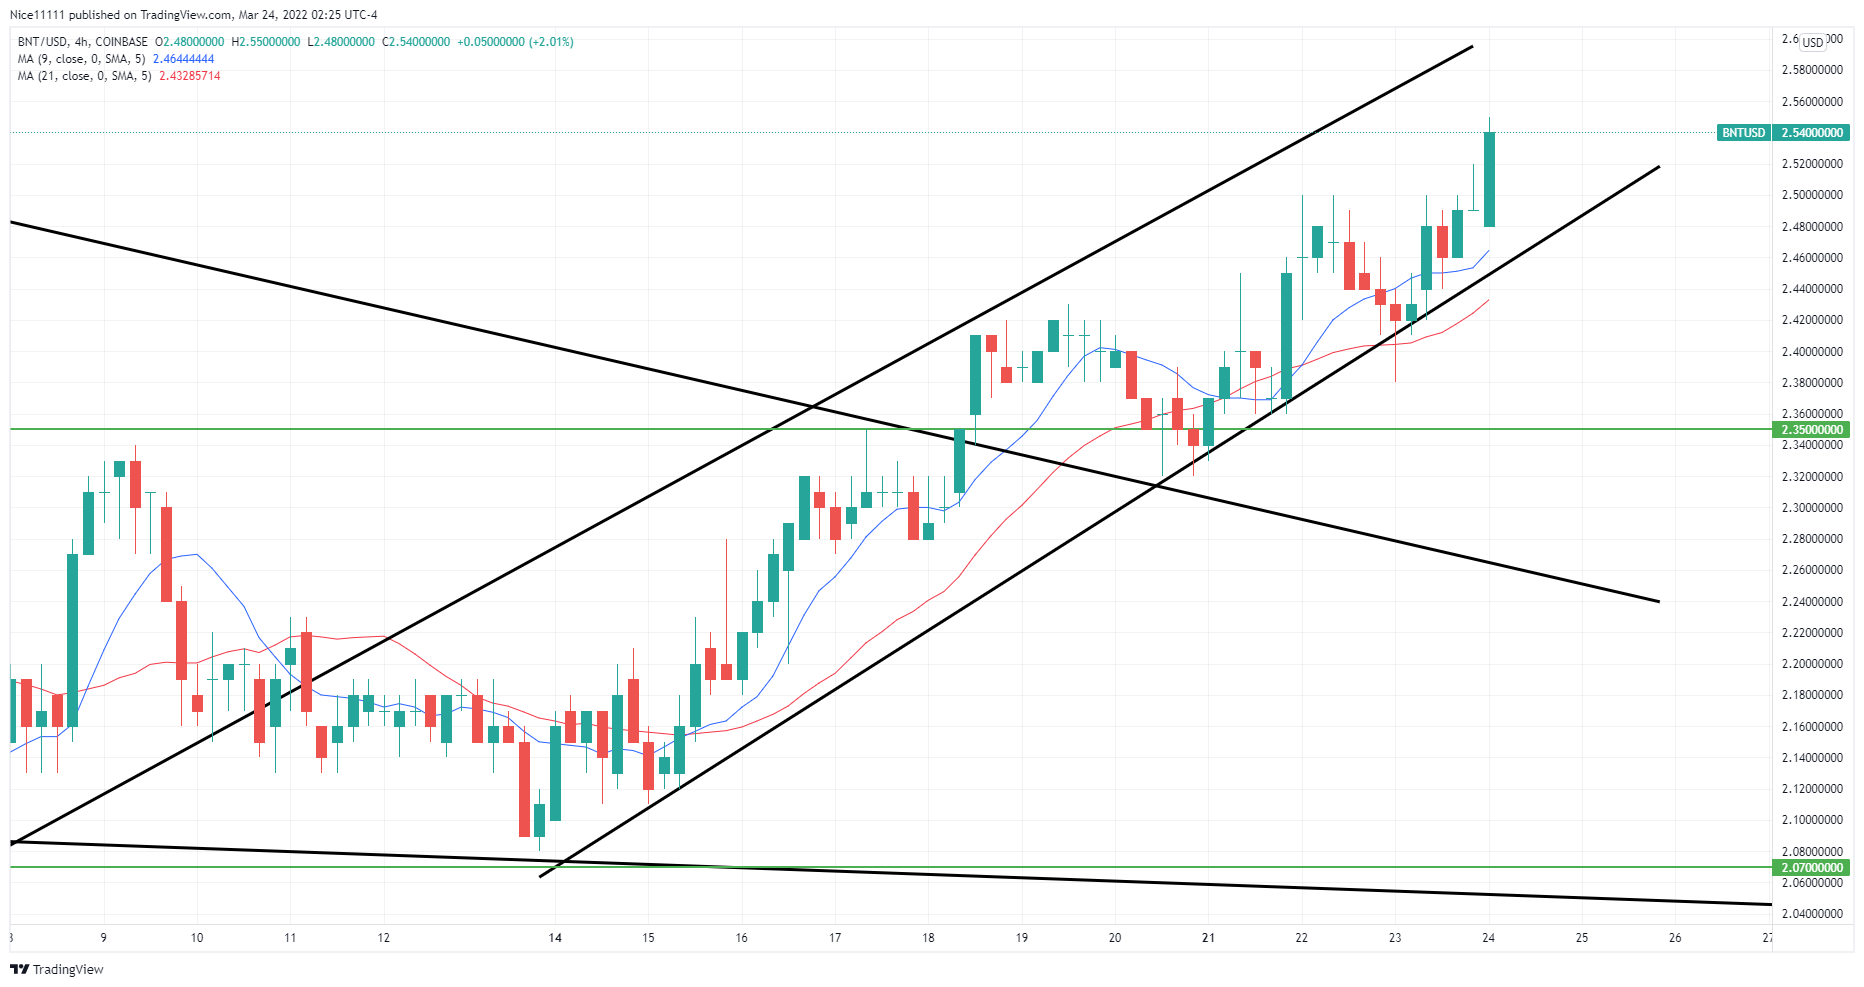
BNTUSD makes a successful breakout in the market as the bulls keep pumping the market price. A successful breakout of the descending triangle on the daily chart is evident. A successful breakout also occurred between the $2.350 level and $2.070 to the upside. There has been a retest at $2.350, which has caused the bulls to run towards $2.720. The Moving Averages on the chart are also supporting the upward move.
How To Buy Lucky Block
Note: Cryptosignals.org is not a financial advisor. Do your research before investing your funds in any financial asset or presented product or event. We are not responsible for your investing results.