Bancor (BNTUSD) Makes Steady Progress Upwards
Estimated Reading Time: 2 minutes
Don’t invest unless you’re prepared to lose all the money you invest. This is a high-risk investment and you are unlikely to be protected if something goes wrong. Take 2 minutes to learn more
Bancor Analysis – Price Makes Steady Movement Upward Through Key Levels
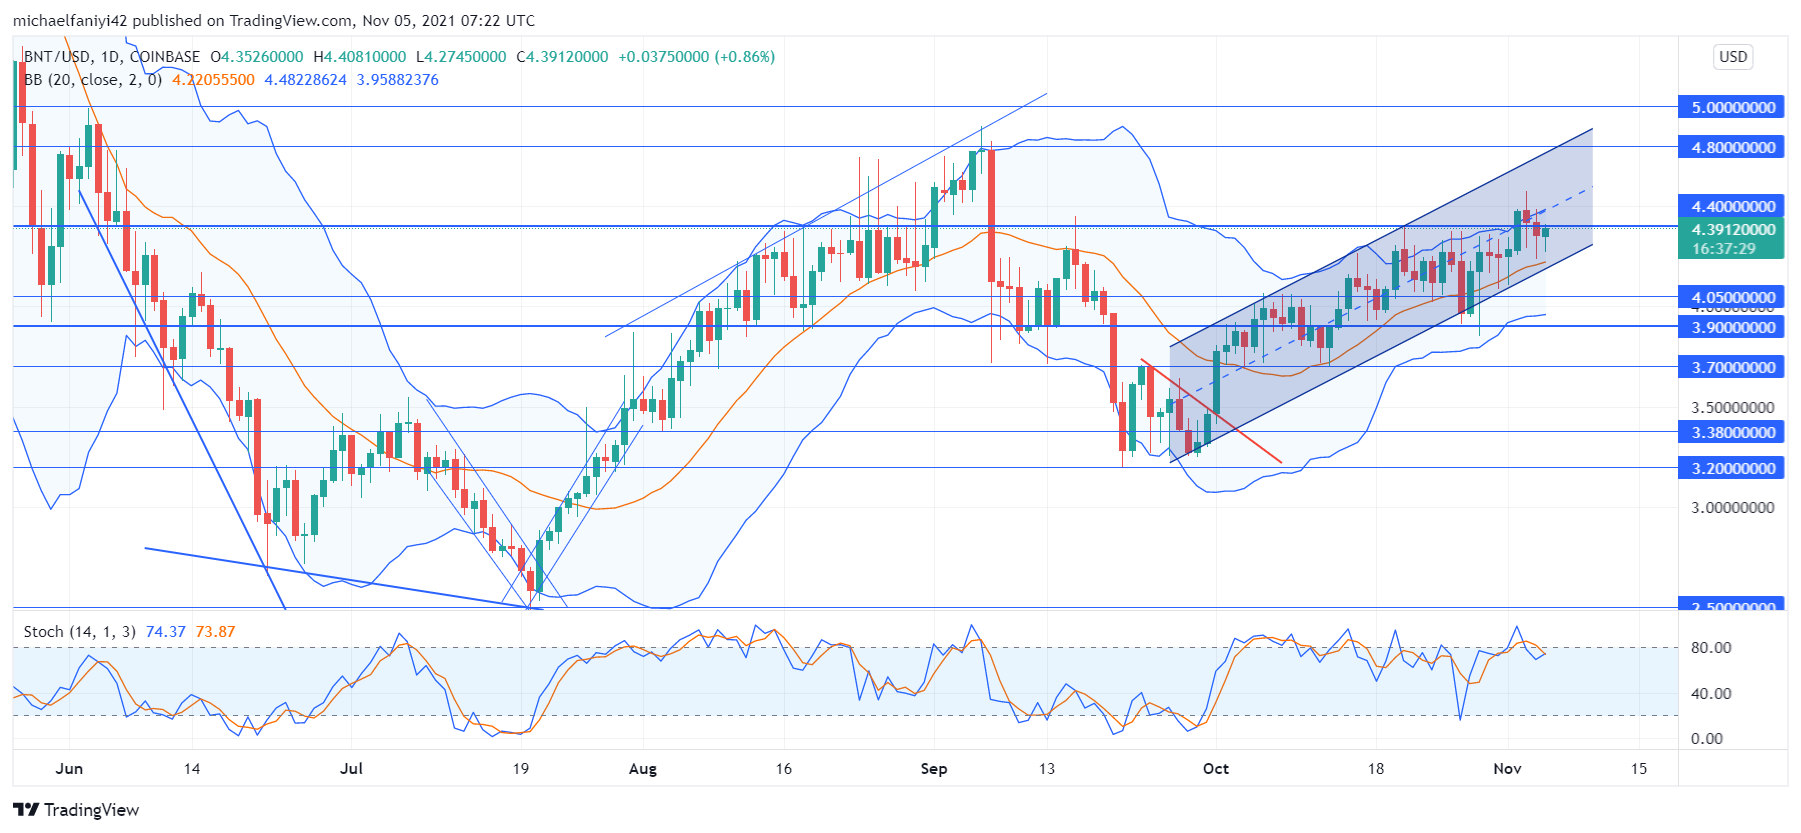
Bancor makes steady progress in an upward direction since breaking out of a triangle pattern. The coin can be seen gliding through an ascending parallel channel. Its movement is characterized by consistent higher highs and higher lows as it makes a steady upward movement. This it does by pulling back to retest the significant levels it has broken through before springing higher. In doing so, the price has drilled past several critical zones.
Bancor Critical Zones
Resistance Zones: $4.400, $4.800, $5.000
Support Zones: $3.200, $3.700, $3.900
Earlier in August, BNTUSD also embarked on a similar pattern of movement as it tries to recover from a serious market depression. Similarly, the price exhibits an upward movement in which it makes steady climbs and creates consecutive higher highs and lows, allowing it to pass through various significant levels. This continued till Bancor hit an impervious resistance at $4.800, which led to a slump in the market.
Now approaching $4.800 once more, and in the same pattern, buyers will be hoping to take one step further than the previous time, and that will be to violate the resistance level. Since breaking out of a reversal triangle pattern, the market has been trading in the upper half of the Bollinger Band with the middle line acting as price support. This shows the eagerness of the buyers to keep up the steady upward movement.

Market Anticipation
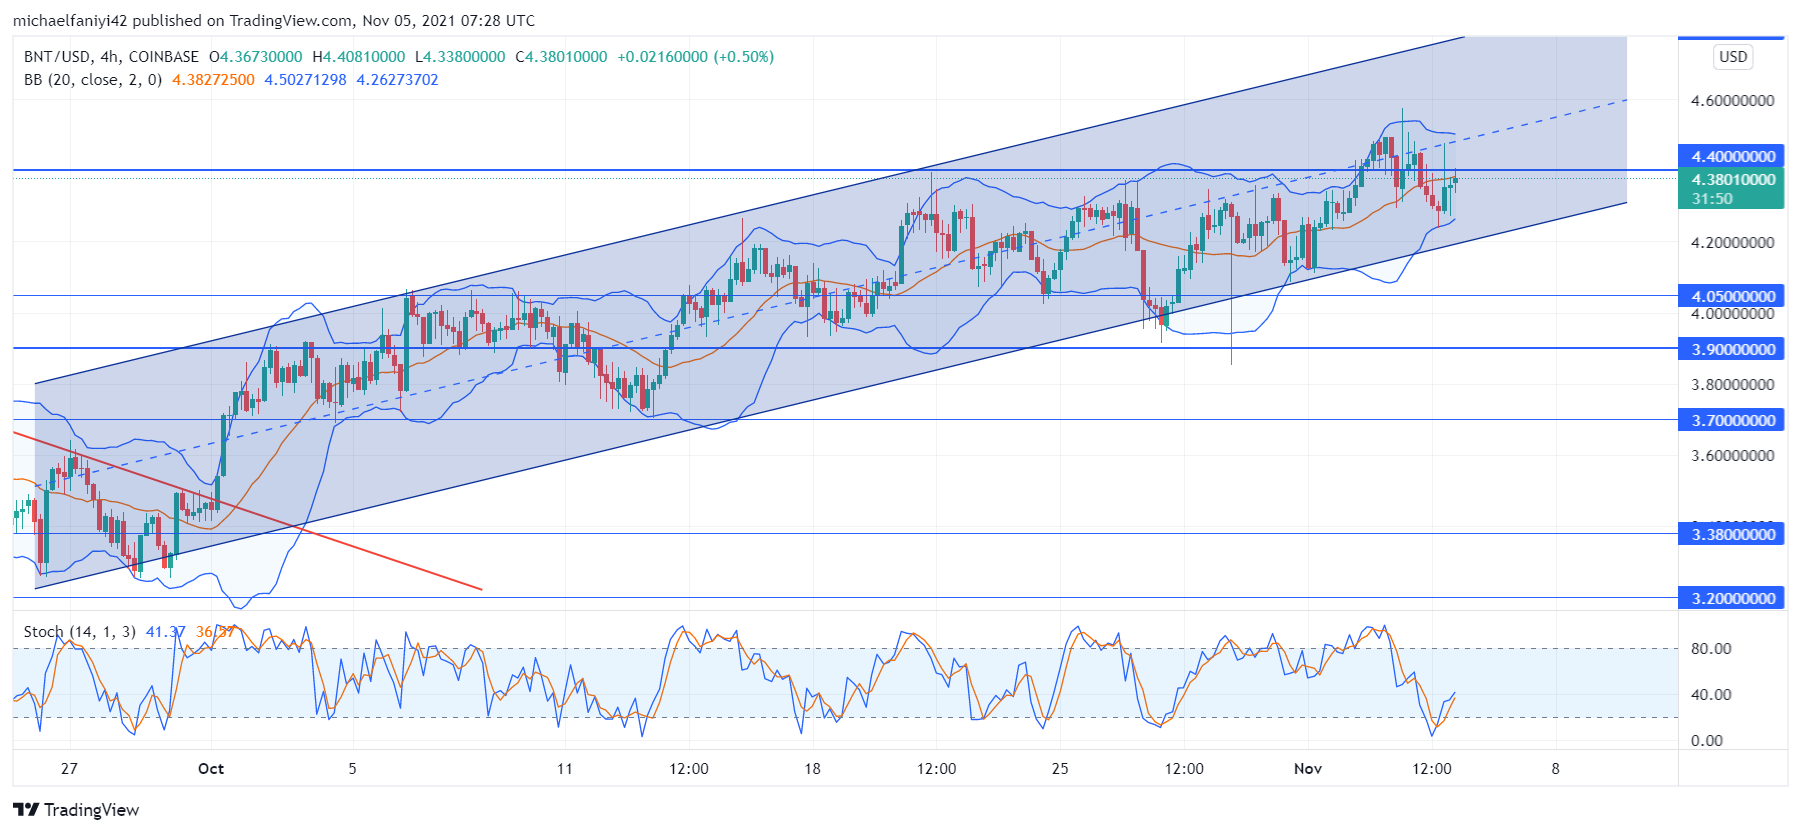
On the 4-hour chart, Bancor makes its first break above the $4.400 resistance before undulating downward again to retest the lower half before launching another attack on the resistance. The Stochastic Oscillator signals in buyers’ favor, because it has dropped to the oversold region and is now pumping out of it again. This shows strength in a bullish direction.
Bancor is expected to finally break and hold above $4.400 to continue its steady movement upwards.
You can purchase crypto coins here: Buy Tokens
Note: Cryptosignals.org is not a financial advisor. Do your research before investing your funds in any financial asset or presented product or event. We are not responsible for your investing results.