Bancor (BNTUSD) Makes Upward Progress After Its Precipitous Drop
Estimated Reading Time: 2 minutes
Don’t invest unless you’re prepared to lose all the money you invest. This is a high-risk investment and you are unlikely to be protected if something goes wrong. Take 2 minutes to learn more
Market Analysis – Bancor Makes An Upward Move Above $4.100
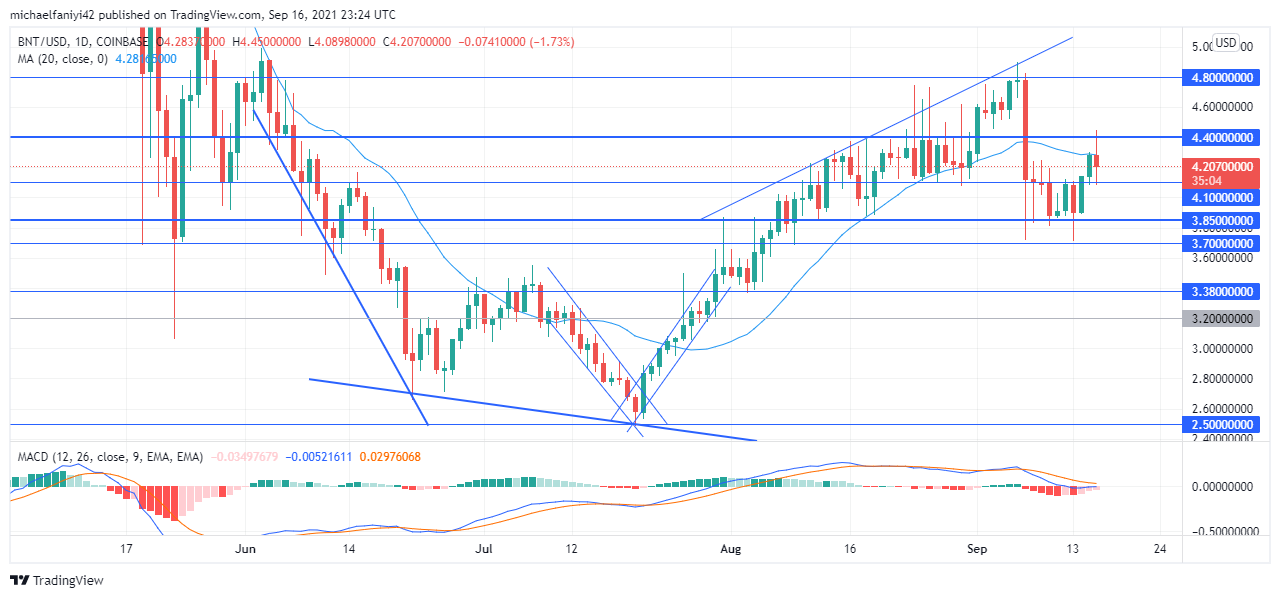
Bancor makes upward progress after climbing above the $4.100 key level. The coin has had to endure a short-term consolidation after which it has adjusted itself for upward movement. The consolidation came after price dropped after failing to subdue the $4.800 resistance level. A bearish engulfment candle ensured that the market dropped by almost 25% to the $3.700 support zone.
Bancor Crucial Zones
Resistance Zones: $4.400, $4.800
Support Zones: $4.100, 3.850
Immediately Bancor makes contact with the $3.700 support, it pushes upward above $4.100. This can be seen in the long wick that is displayed by the September 7th candlestick. Price was unable to sustain its hold above $4.100 and fell below $3.850. It was at this point that Bancor started to range with the $4.100 mark as resistance. After cranking within this zone for about 5 days, bulls built momentum to again move upward of $4.100.
Price climbed above $4.100 on the 14th of September and it is now making further moves to move higher still. The coin faces the first barrier of trading above the MA period 20 (Moving Average). If it succeeds in this, then it will be well placed to climb further upward. There are optimistic signs from the MACD (Moving Average Convergence Divergence) that Bancor will indeed move up. Its signal lines are on the verge of crossing each other upward. The bearish histogram bars are already reducing in size.

Market Predictions
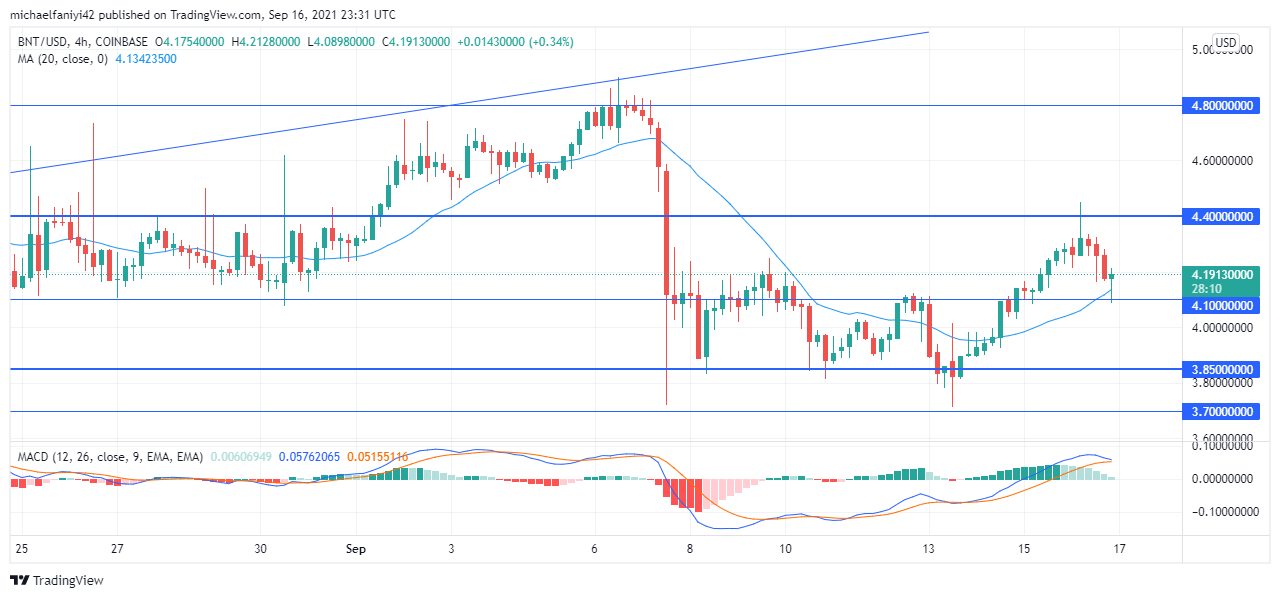
Price has broken through the MA period 20 on the 4-hours chart and is now testing it against the $4.100 support level. The MACD indicator readily shows a bullish market scenario. It displays bullish histogram bars, and its lines remain above the zero level, about to cross over each other to the upside.
When the market bounces off this level, it will move towards the $4.400 resistance level to break it.
You can purchase crypto coins here: Buy Tokens
Note: Cryptosignals.org is not a financial advisor. Do your research before investing your funds in any financial asset or presented product or event. We are not responsible for your investing results.