Bancor (BNTUSD) Sinks Further Downward Under Bearish Pressure
Estimated Reading Time: 2 minutes
Don’t invest unless you’re prepared to lose all the money you invest. This is a high-risk investment and you are unlikely to be protected if something goes wrong. Take 2 minutes to learn more

Free Crypto Signals Channel
Bancor Analysis – Price Sinks Further Below $2.050 Under Bearish Pressure
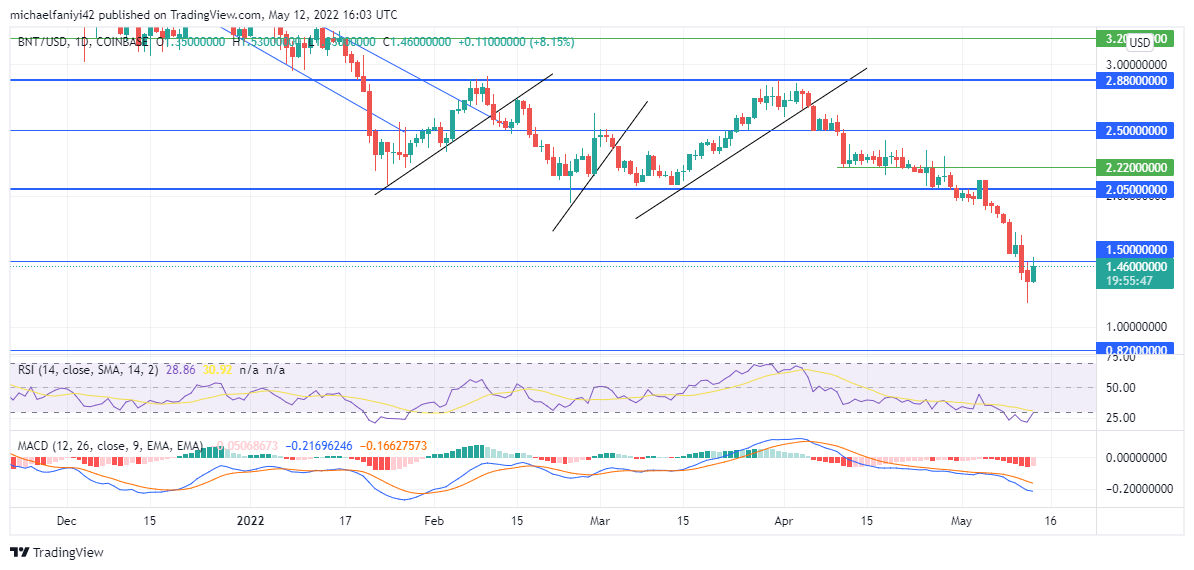
Bancor sinks further below the $2.050 price level under intense bearish pressure. The price has been struggling for a while, confined to consolidation between critical levels. The $2.880 level limited the market from going up, while the $2.050 significant level sealed the coin from below, preventing it from dropping. However, after four months of ranging, the market sinks below $2.050 under bearish pressure.
Bancor Key Levels
Resistance Levels: $2.880, $2.500
Support Levels: $2.050, $1.500
The market consolidation represents a display of the tussle for power by opposing market forces. The price could have moved either way, but the bears slightly edged the market. Bancor bulls still had the opportunity to win over the bears when they forged the price candles into a double bottom design. The coin rose, but it still couldn’t violate the resistance level at $2.880.
Immediately afterwards, the bears plunged the market steadily. Even though the market wanted to stabilize itself at a significant level of $2.220, bearish pressure persisted, and the coin sinks further. Currently, the coin has traded below another strong level at $1.500. The market is thus in a bearish mood, which can be seen in the southward trend of the indicators. The Moving Average Convergence Divergence and the Relative Strength Index have their lines dipping seriously.

Market Expectations
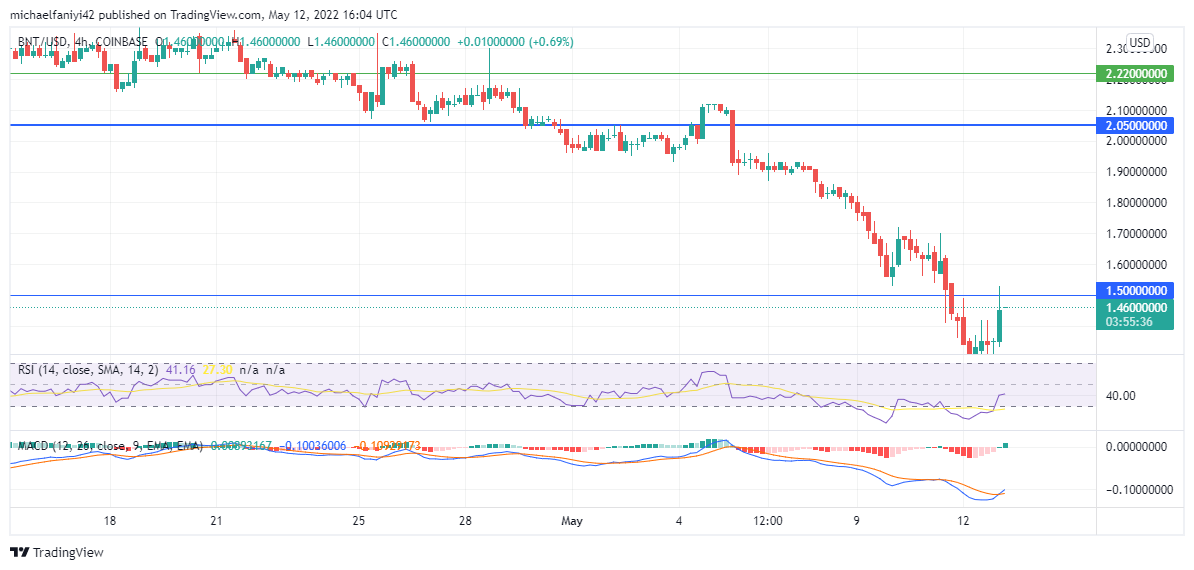
The 4-hours chart shows a slight retracement at $1.500 before the market then drove forcefully downward. The MACD lines have been down-trending after dropping below the zero level. The RSI, likewise, shows that the market is deeply oversold. All indications point to dominant bears, and we can expect the price to drop further to $0.820.
How To Buy Lucky Block
Note: Cryptosignals.org is not a financial advisor. Do your research before investing your funds in any financial asset or presented product or event. We are not responsible for your investing results.