Bancor (BNTUSD) Suffers a Setback, but Price Bullish Campaign Continues
Estimated Reading Time: 3 minutes
Don’t invest unless you’re prepared to lose all the money you invest. This is a high-risk investment and you are unlikely to be protected if something goes wrong. Take 2 minutes to learn more
Bancor Analysis the Bullish Campaign Continues Even as the Market Suffers a Setback
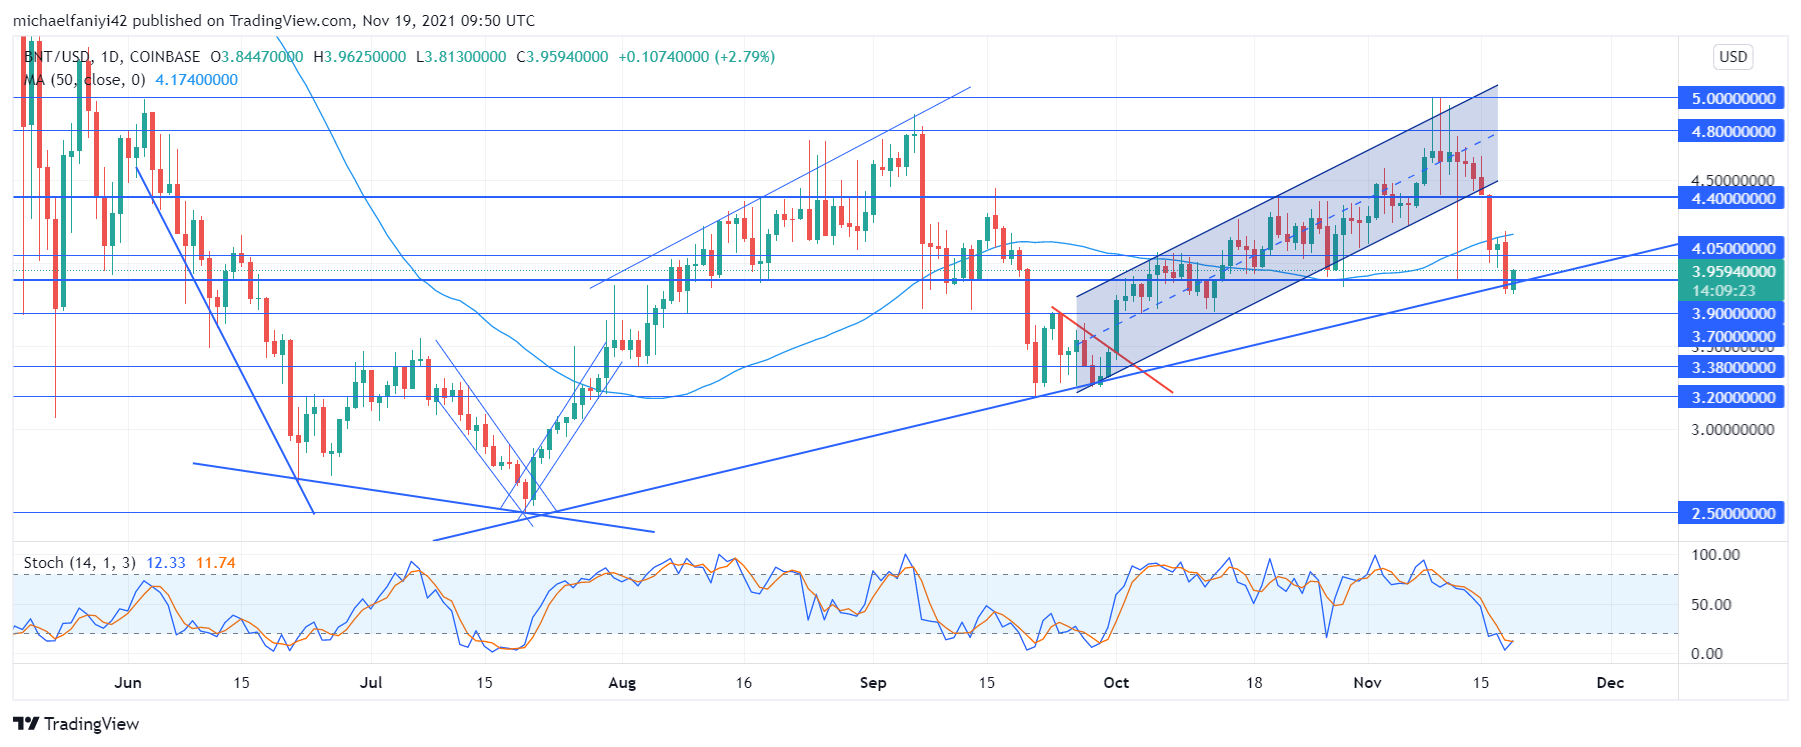
Bancor suffers a setback as it plunges, but it doesn’t abort its bullish campaign. A steady uptrend comes to a sudden end after the coin took a smart dive out of its ascending channel, but the bullish campaign continues. Before Bancor dropped, it can be seen fluctuating around the middle line of its ascending channel, making an effort to climb above it. This can be seen as the candles’ long wicks reach the upper border. The immediate uptrend has been aborted due to the failure of the market.
Bancor Key Zones
Resistance Zones: $5.000, $4.800, $4.400
Support Zones: $3.900, $3.200, $2.500
Despite the current setback, Bancor is still in an overall uptrend that began when the price began to rise from the $2.500 support level. The uptrend continued climbing through several key levels till it got to $4.800, after which the coin dropped. Support at $3.900 was not enough to prevent a further market drop. However, the price halt and reversal happened at $3.200, which is a higher low for the coin.
Bulls began engineering another move up through a triangle formation. Breaking out, the coin began gliding up through a parallel channel. This continues till the price suffers a fresh setback by suddenly plunging down the channel on the 15th of November and dashing through the MA period 50 (Moving Average). However, the $3.900 support is keeping the price afloat this time to make a new higher low. We are also optimistic about a reversal here, even as the Stochastic Oscillator lines are about to cross from the oversold region.

Market Expectations
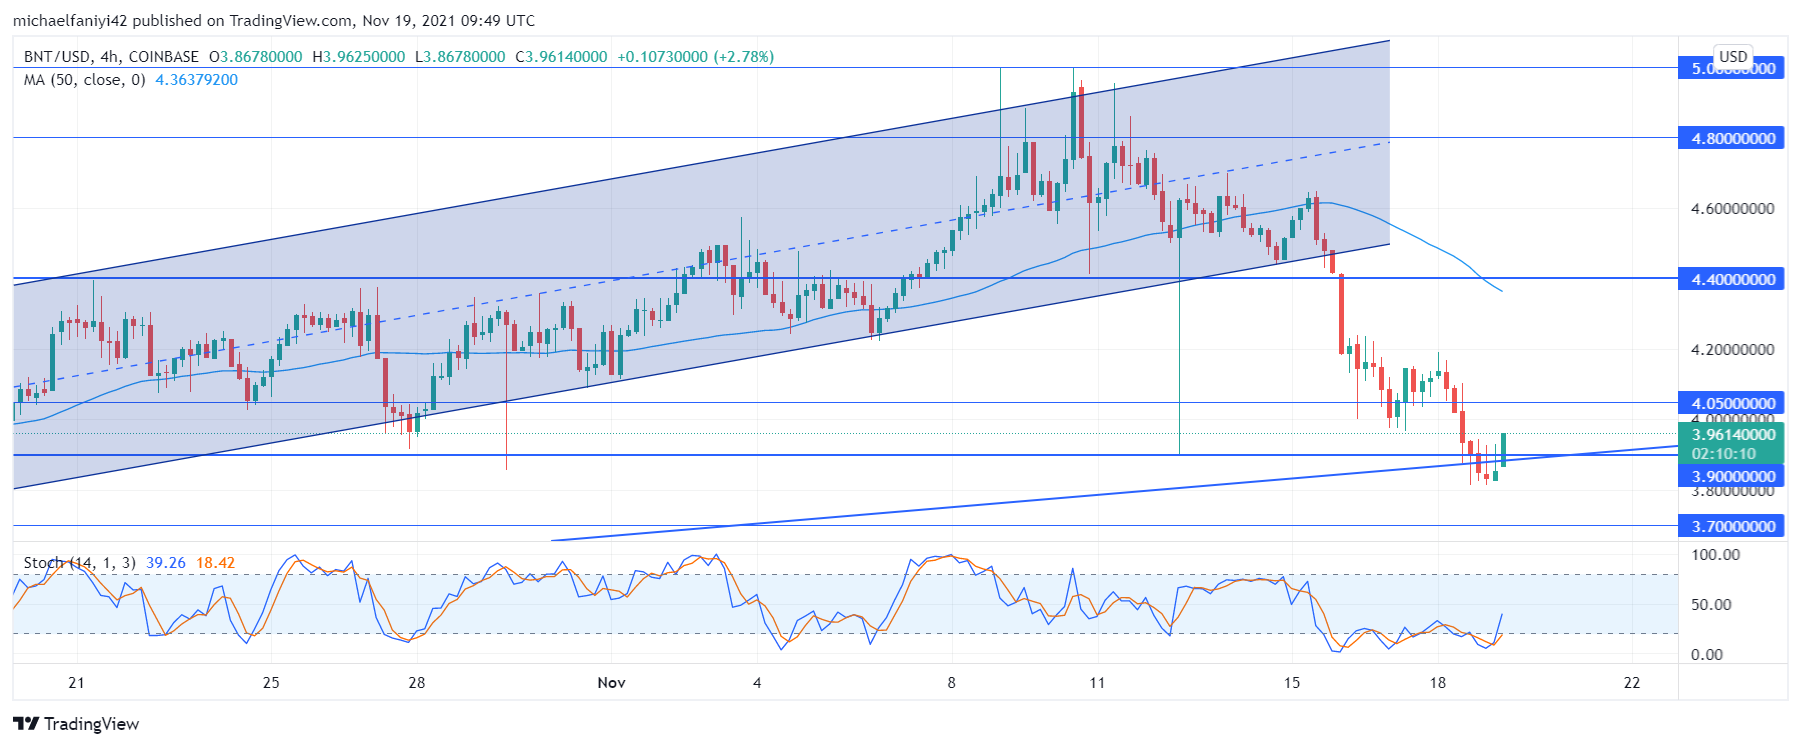
On the 4-hour chart, there are signs of price reversal as the market displays a series of reversal candlesticks such as the inverted hammer. This is followed by a strong bullish candlestick. The Stochastic Oscillator confirms this with a golden cross of its lines upward from the oversold region.
The coin is expected to ascend and reach $4.400 before further bullish moves.
You can purchase crypto coins here: Buy Tokens
Note: Cryptosignals.org is not a financial advisor. Do your research before investing your funds in any financial asset or presented product or event. We are not responsible for your investing results.