Bancor (BNTUSD) Takes First Steps to Break Bearish Cycle
Estimated Reading Time: 2 minutes
Don’t invest unless you’re prepared to lose all the money you invest. This is a high-risk investment and you are unlikely to be protected if something goes wrong. Take 2 minutes to learn more

Free Crypto Signals Channel
Bancor Analysis – Price Takes the First Steps to Break the Bearish Regime
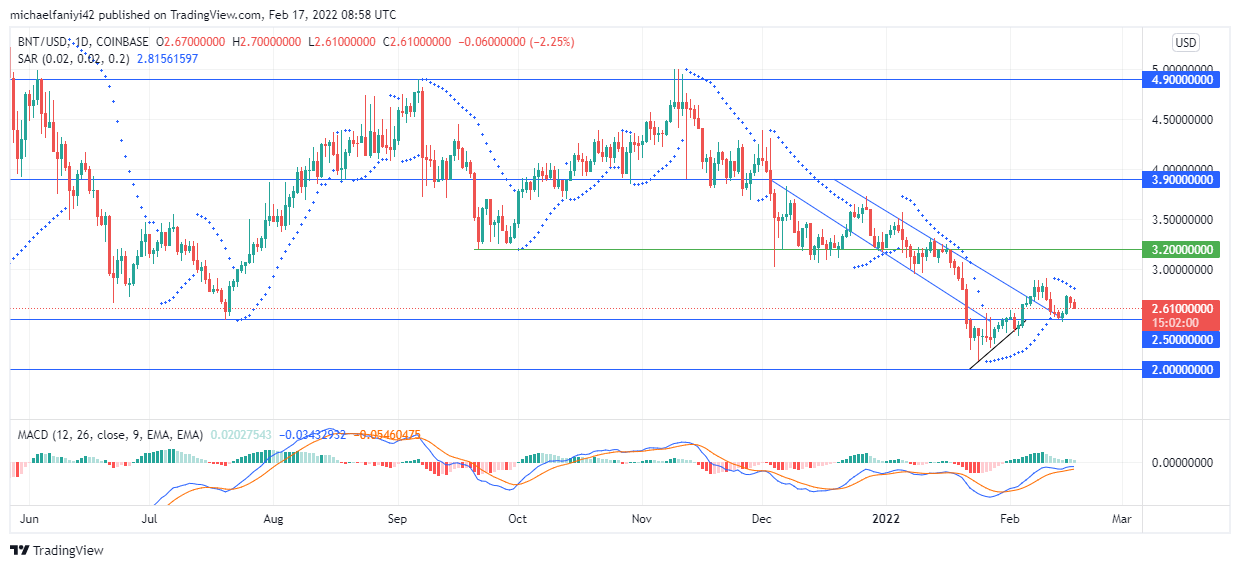
Bancor takes the first steps to break the bearish hold on the market. The first action of the coin as it drops to $2.000 is to taper upward through a triangle structure. This puts pressure on the immediate level above ($2.500) till it makes way for a price rise. Thereafter, Bancor rises and pierces through the upper border of the descending channel. Having risen above the channel, the market now pulls back to the confluence of the border channel and the $2.500 level.
Bancor Key Levels
Supply Levels: $3.200, $4.900
Demand Levels: $2.000, $2.500
The $3.200 level represents a significant level at which Bancor tries to contain the downward movement of its price. The market first dropped to that level last September. There was much pressure, but the level remained impervious. The price then bounced upward till it reached the weekly resistance at $4.900, from where the market was set on another downtrend. BNTUSD broke through all key levels till it reached $3.200 again.
At the second retest of $3.200, there was greater pressure on the price level, which caused the level to bulge, making way. The price slid through a channel and dropped further beyond $2.500. At $2.000, there is price accumulation as Bancor takes the first steps to break the market slump. The MACD (Moving Average Convergence Divergence) takes a positive position by crossing upward from below the zero level.

Market Expectation
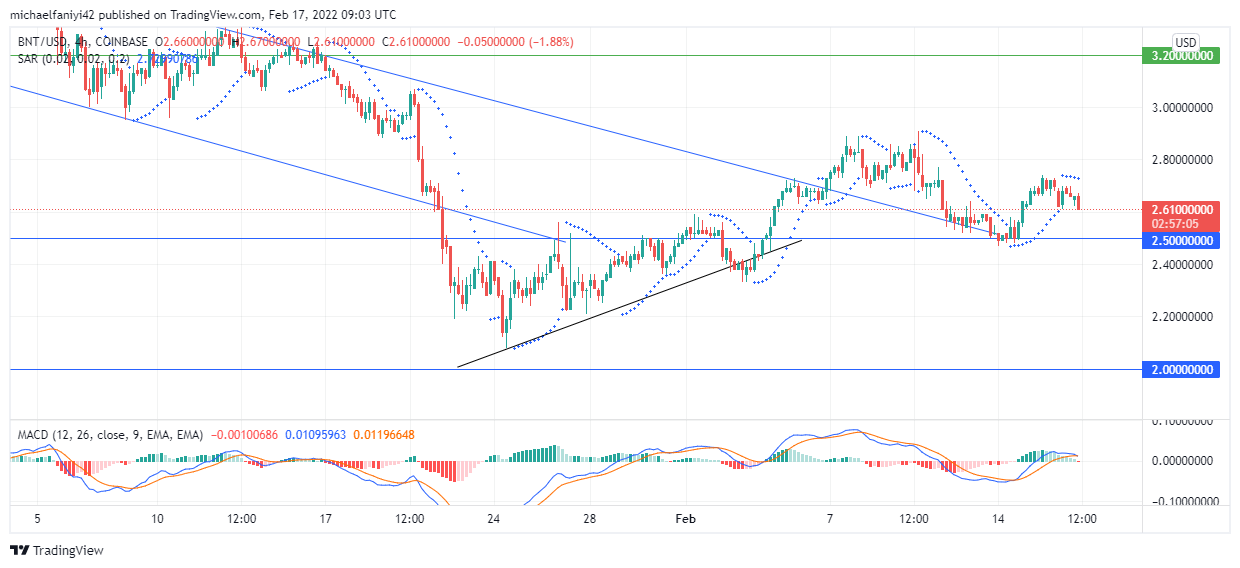
The 4-hour chart shows that the price has broken the shackles that have kept it pinned down. It did this by violating the $2.500 level and breaching the upper border of the descending channel. The coin is dropping to retest the $2.500 level as it prepares to push higher again above $3.200. The Parabolic SAR currently shows a pullback towards the $2.500 support.
Note: Forexschoolonline.com is not a financial advisor. Do your research before investing your funds in any financial asset or presented product or event. We are not responsible for your investing results.