Band Protocol (BANDUSD) Aims to Reach a Demand Zone
Estimated Reading Time: 2 minutes
Don’t invest unless you’re prepared to lose all the money you invest. This is a high-risk investment and you are unlikely to be protected if something goes wrong. Take 2 minutes to learn more
Band Protocol Analysis – Price Aims for the $4.310 Demand Zone
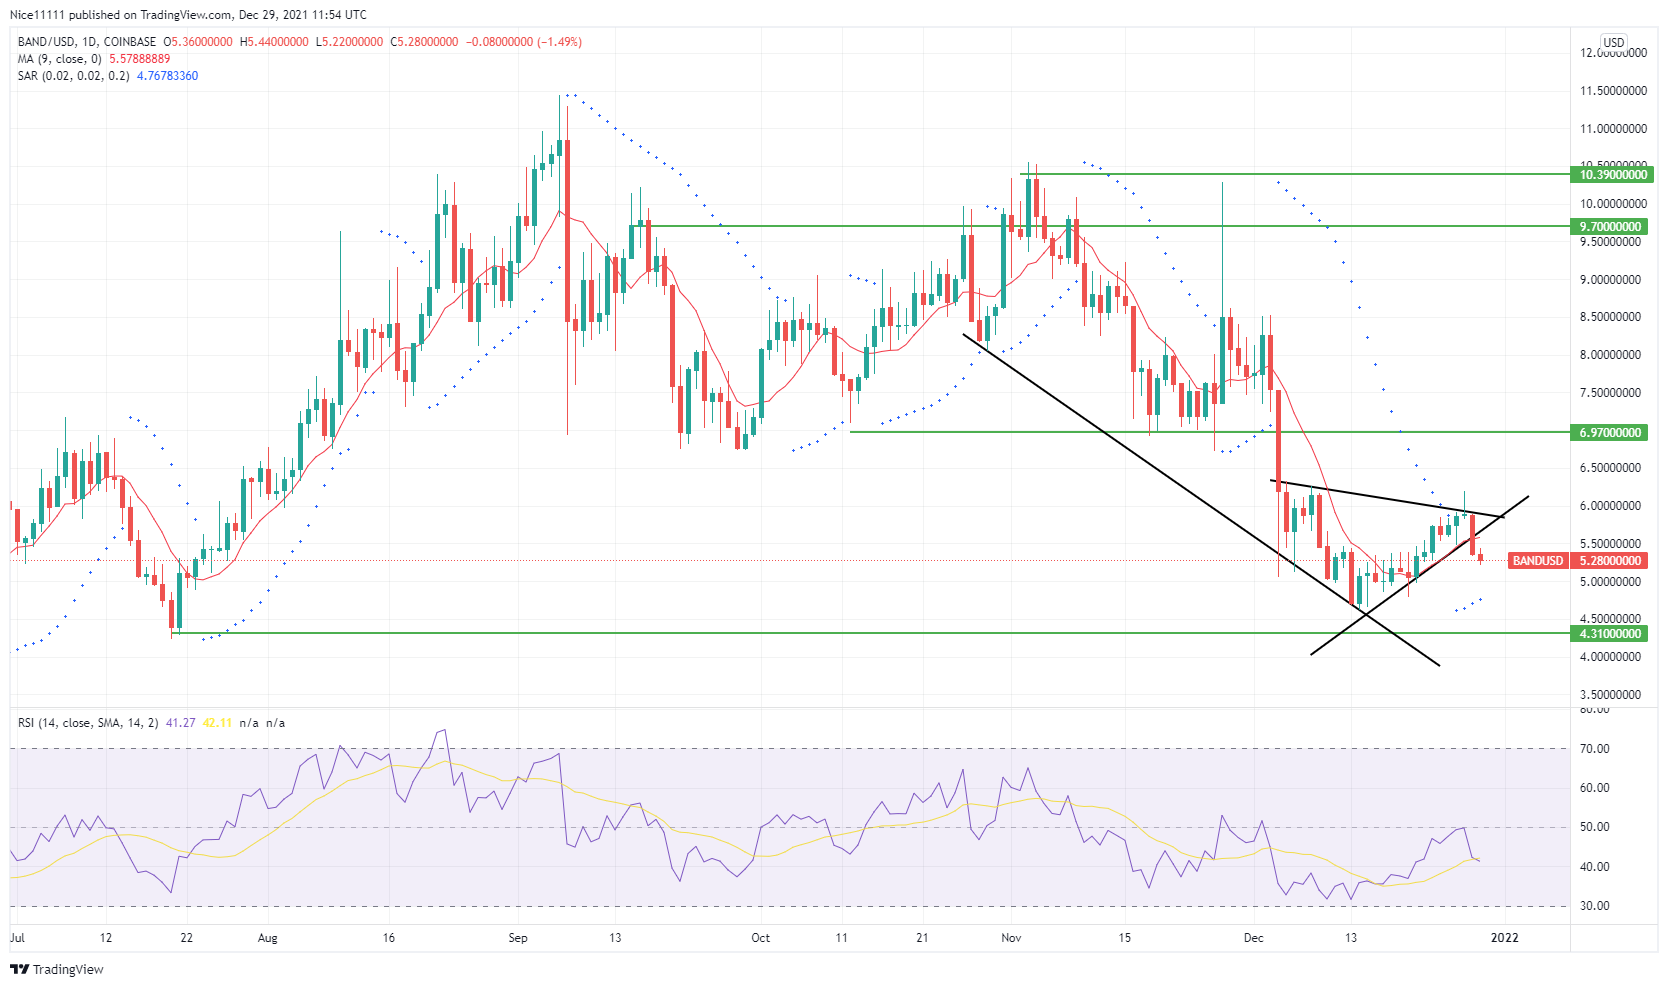
Band Protocol aims for a demand zone just below the current market price. The market has been moving sideways between the $9.700 supply zone and the $6.970 demand zone. An attempt by the bulls to break above $9.700 on the 3rd of November was a failure. Then the market crashed from the $9.700 zone down into a support zone at $6.970. The zone was defended as the bulls used the opportunity to get in sync. Once again, they failed to breach the supply zone on the 27th of November.
Band Protocol Major Zones
Demand Zone: $10.390, $9.700
Supply Zone: $6.970, $4.310
After some retracement, the bears stepped in at the supply zone and violated the demand zone at $6.970. The Moving Average swung low as the candles rested beneath the daily timeframe. The downward trending line acted as minor support where the price bounced off. The demand zone was untapped before the retracement was initiated on the 14th of December.
A bearish candle was spotted on the daily chart yesterday, the 28th of December. This shows that the bears are still aiming for the demand zone. A symmetrical triangle has been breached today as at the time of writing. The bears stepped in, utilizing resistance at the top of the symmetrical triangle to continue their bearish move as they aim for the Band Protocol demand zone.

Market Expectations
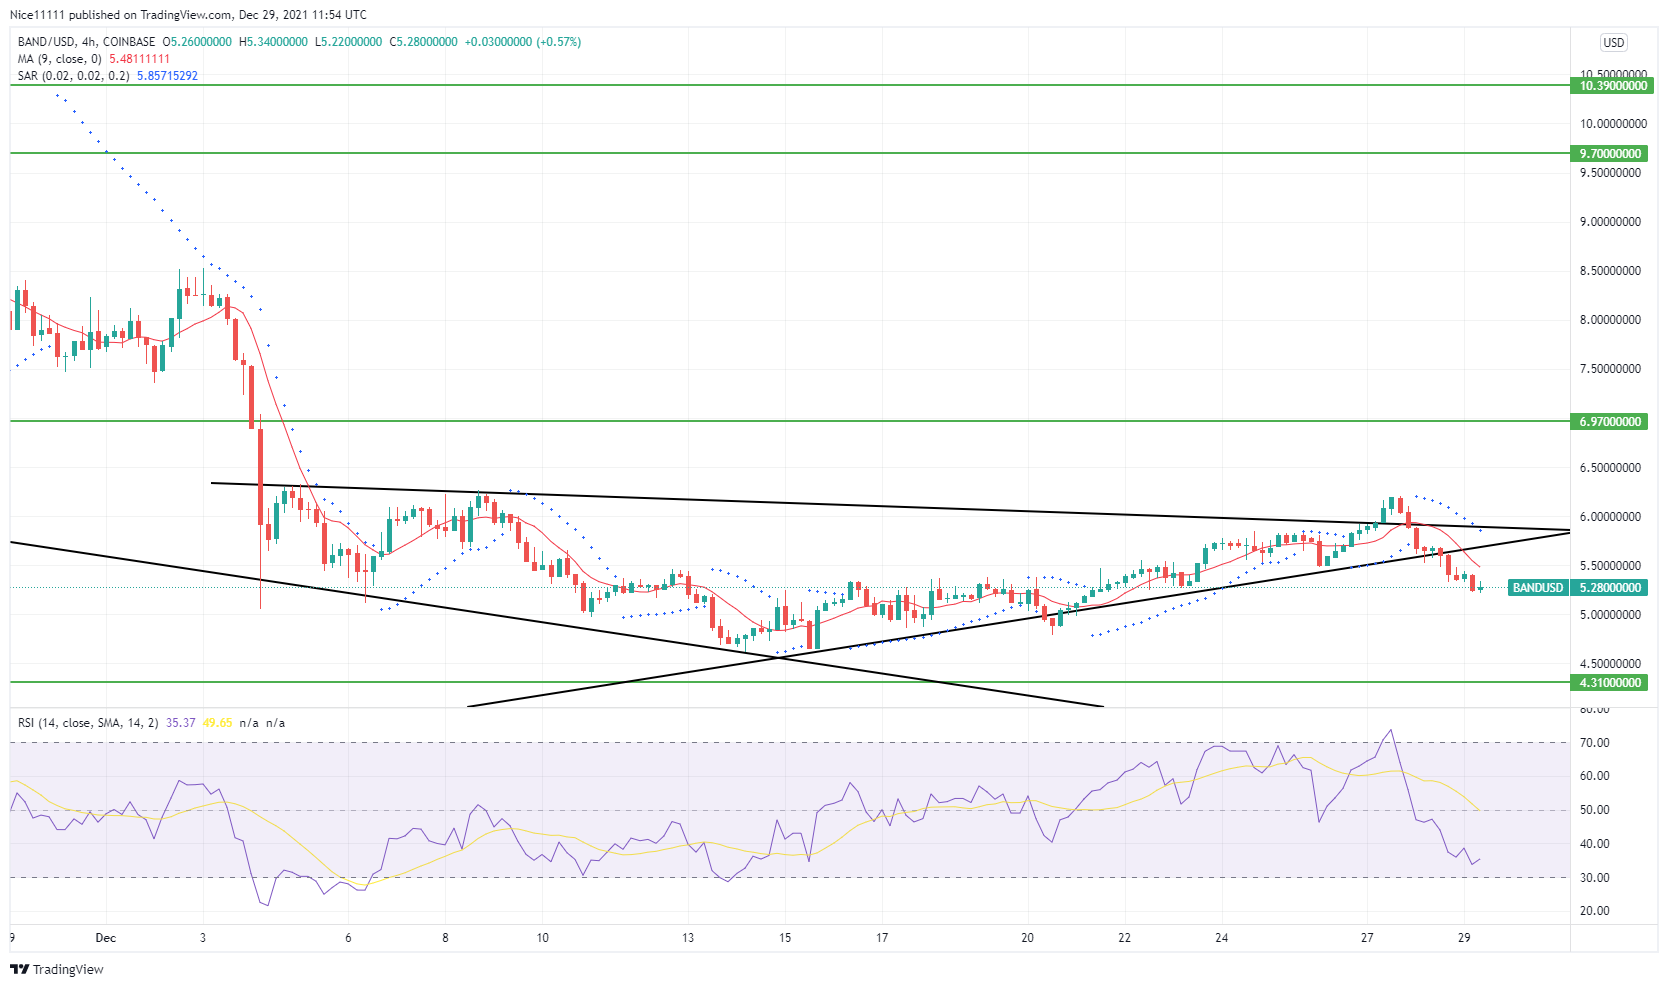
The symmetrical triangle is expected to be retested to sink the price towards the demand zone at $4.310. The Parabolic Stop and Reverse indicator on the four-hour chart has formed multiple points, showing early bearish signs. In the same timeframe, the Relative Strength Index is also bearish. Three black crows formed within the symmetrical triangle. This has caused the Moving Average period 9 to rest above subsequent candles as it slopes downward. The demand zone is likely to be tested soon as the market aims for $4.310.
You can purchase crypto coins here: Buy Tokens
Note: Cryptosignals.org is not a financial advisor. Do your research before investing your funds in any financial asset or presented product or event. We are not responsible for your investing results.