Band Protocol (BANDUSD) Continues Zigzagging Below the $6.900 Resistance Zone
Estimated Reading Time: 3 minutes
Don’t invest unless you’re prepared to lose all the money you invest. This is a high-risk investment and you are unlikely to be protected if something goes wrong. Take 2 minutes to learn more
Market Analysis – BAND Zigzagging Movement Continues as Price Aims for $6.900 Again
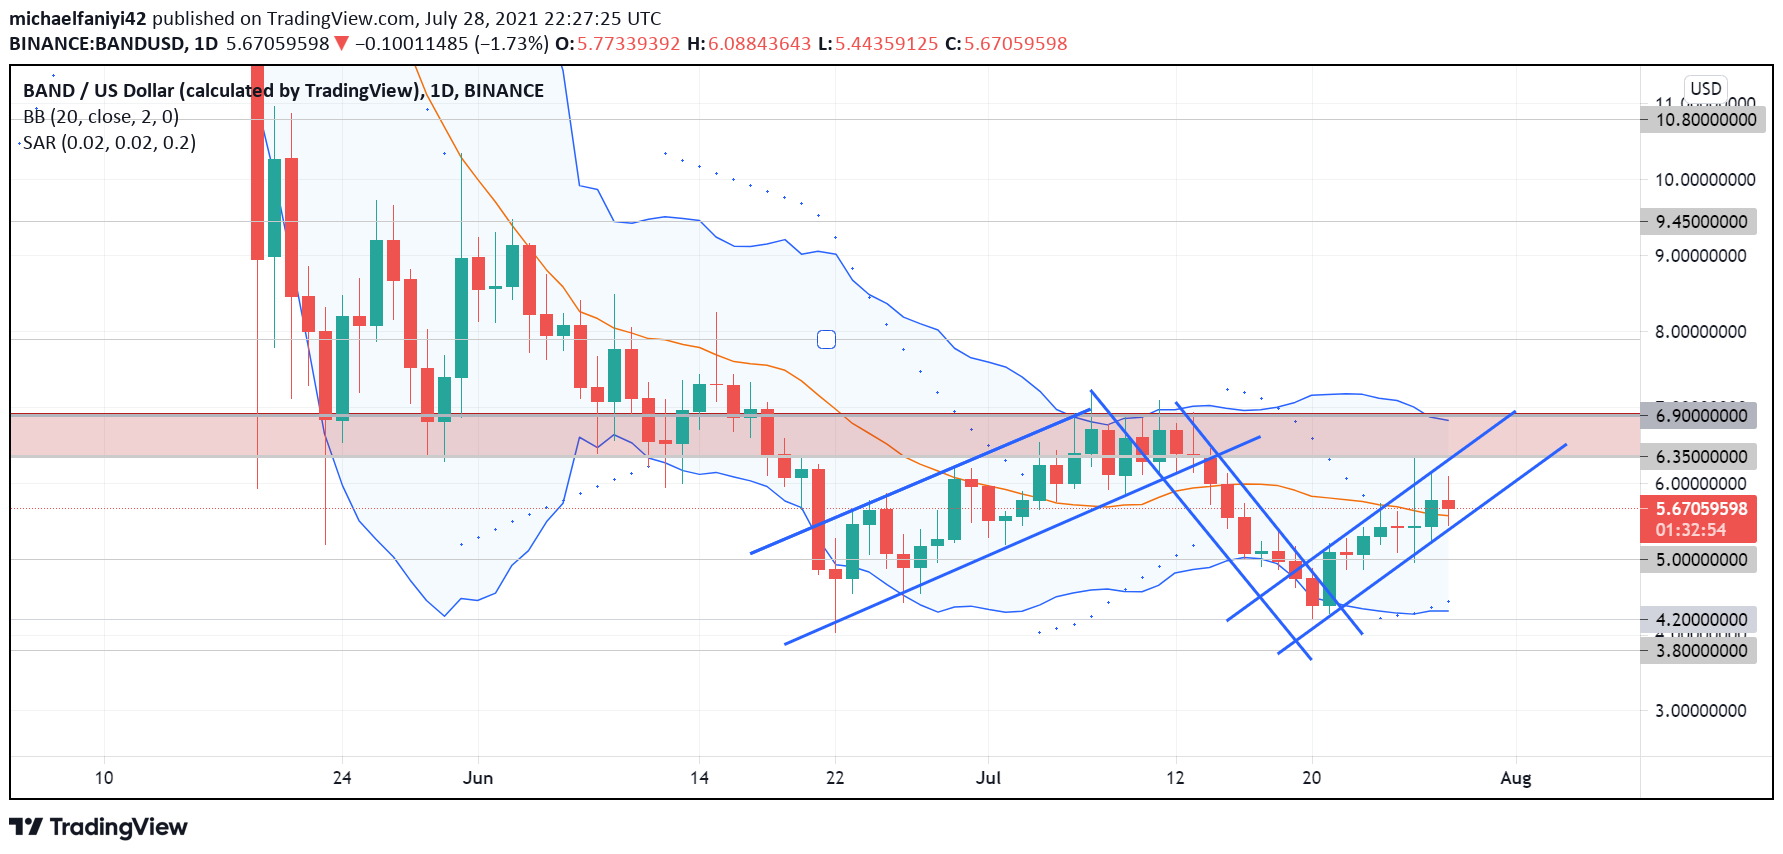
BAND continues zigzagging after bouncing up from $4.200. This is the second time that the coin has bounced off this support level to push higher. The first instance came after price fell off its support at $6.900 on the 18th of June 2021. It slumped and fell directly to the $4.200 support. At this level, buyers instantly started pumping the market. They did this consistently till their power became futile when trying to break back above the $6.900 resistance zone.
BANDUSD Key Levels
Resistance Levels: $6.350, $6.900, $7.900
Support Levels: $5.000, $4.200, $3.800
After seven days of laying a siege below the $6.900 resistance, the coin began a decline. The price drop took it directly back to $4.200. Just as in the previous time, buyers stepped in to push the coin up. BAND is once more on its way up. This movement ensures the coin continues in its zigzagging pattern. On its way up, the market had to rely heavily on the $5.000 key level for support.
Though BAND is currently displaying a Doji candlestick, which speaks of market indecision, the Parabolic SAR (Stop and Reverse) confirms that the coin is already in an uptrend. It has aligned 5 dots below these daily candles. The middle line of the Bollinger Band is gradually shifting below the daily candles to also support its upward momentum.

Market Prospects
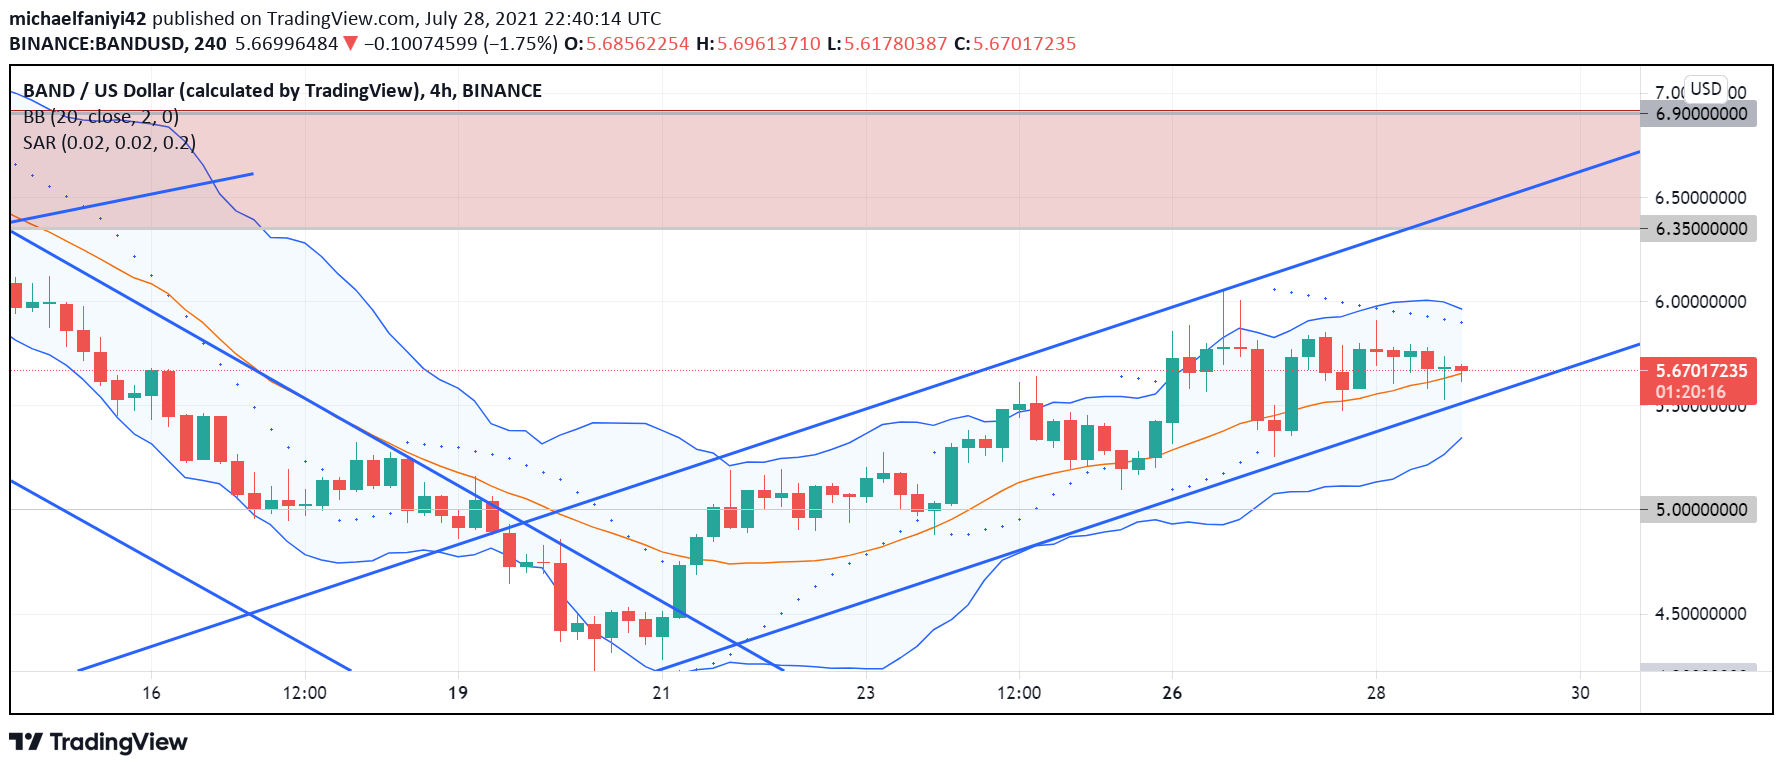
On the 4-hour chart, the middle line of the Bollinger Band has lifted the market and is actively supporting its upward movement. The candles are also rebounding off the upper border of the Bollinger Band to produce a zigzagging movement and price continues in an uptrend. Currently, the candles have fallen again from the upper border to the middle line as the coin continues its uptrend. The Parabolic SAR has its dots above the 4-hour candles to show this fall.
BAND will continue zigzagging upwards till it reaches the $6.900-$6.350 resistance zone for further reactions.
You can purchase crypto coins here. Buy Tokens
Note: Cryptosignal.org is not a financial advisor. Do your research before investing your funds in any financial asset or presented product or event. We are not responsible for your investing results.