Band Protocol (BANDUSD) Remains Silent After Price Drop Below the $2.8900 Threshold
Estimated Reading Time: 3 minutes
Don’t invest unless you’re prepared to lose all the money you invest. This is a high-risk investment and you are unlikely to be protected if something goes wrong. Take 2 minutes to learn more

Free Crypto Signals Channel
BANDUSD Analysis – The Market Remains Silent Following the Price Drop Below the $2.8900 Threshold
BANDUSD Remains Silent after Price Drop Below The $2.8900 Threshold. As prices continue to fall below the key level of $2.8900, BAND Protocol has chosen to maintain a wall of silence for the time being. The token is currently undergoing an accumulation phase as a result of a sudden decline in its value. As BAND Protocol continues to engage the prospects in this phase, traders brace themselves for further movement or a shift in the price trend.
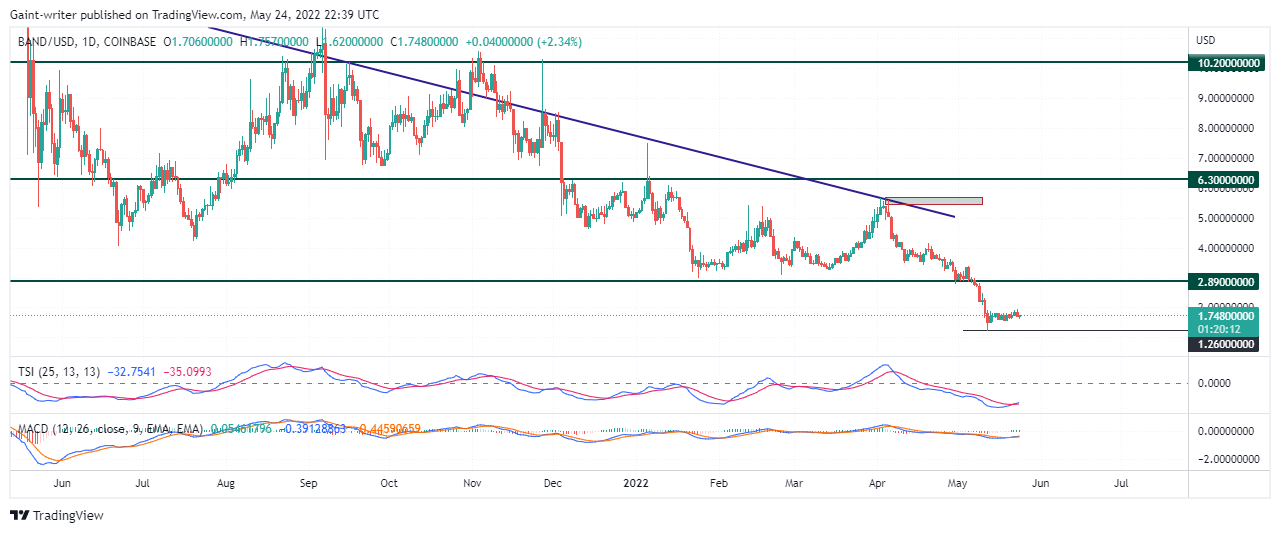
As a result of the bearish prospects, the value of BANDUSD has been subjected to a dominant downtrend tendency for a long time. This started happening immediately after the buyers swung the price from the crucial level of $6.300 up to the key level of $10.200. A bearish expansion happened because buyers couldn’t control the price action above the key level of $10.200. This led to the sellers taking control of the market in the end.
BAND Protocol Crucial Levels
Resistance Levels: $10.200, $6.300
Support Levels: $2.890, &1.260
The market remains on a downward ride. A continuous market swing was seen till the BANDUSD protocol declined below $2.890, an important level. The selling expansion eventually arrived at a significant level of $1.260. The price sentiment has begun to accumulate above this important level on the daily chart. BANDUSD structure may imply that when more institutional order is added, there will be a change in price tendency.
The sellers are moving closer and closer to riding the market influence down. The market continued to move in a volatile direction until the BANDUSD protocol dropped below the important level of $2.890. The increase in selling continued until it eventually reached the significant level of $1.260. On the daily chart, the price sentiment has begun to accumulate above this significant level. This is a bullish sign. The way BANDUSD is set up could mean that the price trend will change once more institutional orders are added to the market.

Market Expectation
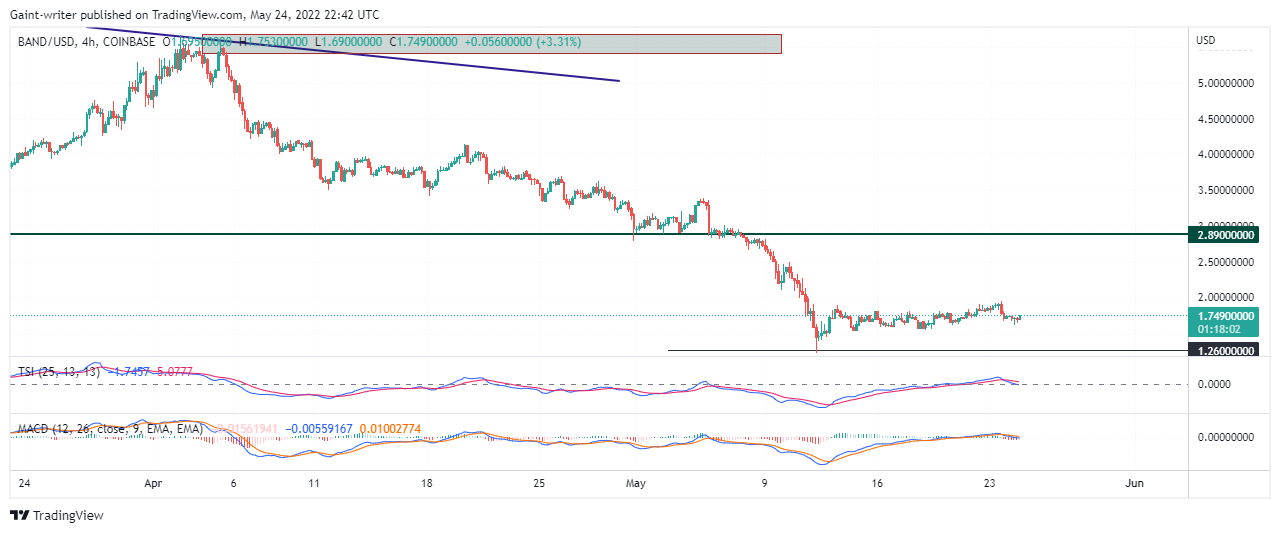
A look at the 4-hour chart shows that the token is following the long-term trend down to the $1.260 critical level. Indicators such as the True Strength Indicator (TSI) show that BANDUSD is likely to remain in the 0.00 range. There is still a signal in the middle region of the MACD (Moving Average Convergence and Divergence Indicator). For the price trend of BANDUSD to change, more positions must be opened.
How To Buy Lucky Block
Note: Cryptosignals.org is not a financial advisor. Do your research before investing your funds in any financial asset or presented product or event. We are not responsible for your investing results.