Binance Coin Fluctuates in a Tight Range, Struggles Below $510 Resistance
Estimated Reading Time: 2 minutes
Don’t invest unless you’re prepared to lose all the money you invest. This is a high-risk investment and you are unlikely to be protected if something goes wrong. Take 2 minutes to learn more
Binance Coin (BNB) Long-Term Analysis: Bullish
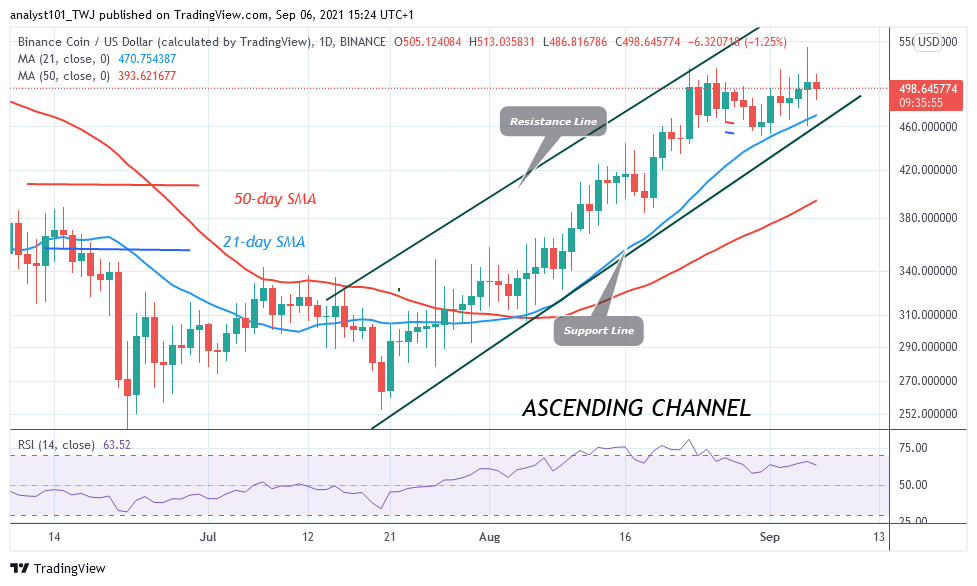
Since August 23, Binance Coin (BNB) has been in a downward correction as the altcoin faced resistance at $520 high. Today, the crypto’s price is retesting the $510 high to break above it. For the past two weeks, buyers have failed to sustain BNB above the $520 overhead resistance. For the past week, the crypto’s price has been fluctuating in a tight range between levels $482 and $510. Further upward move is likely as the altcoin’s price is above the moving averages.
Binance Coin (BNB) Indicator Analysis
Binance Coin is at level 63 of the Relative Strength Index period 14. It indicates that the coin is in the bullish trend zone and above the centerline 50. The crypto is capable of rising on the upside. The crypto is above the 78% range of the daily stochastic. It indicates that the market is in a bullish momentum and it is approaching the overbought region.
Technical indicators:
Major Resistance Levels – $640, $660, $680
Major Support Levels – $540, $520, $500
What Is the Next Direction for Binance Coin (BNB)?
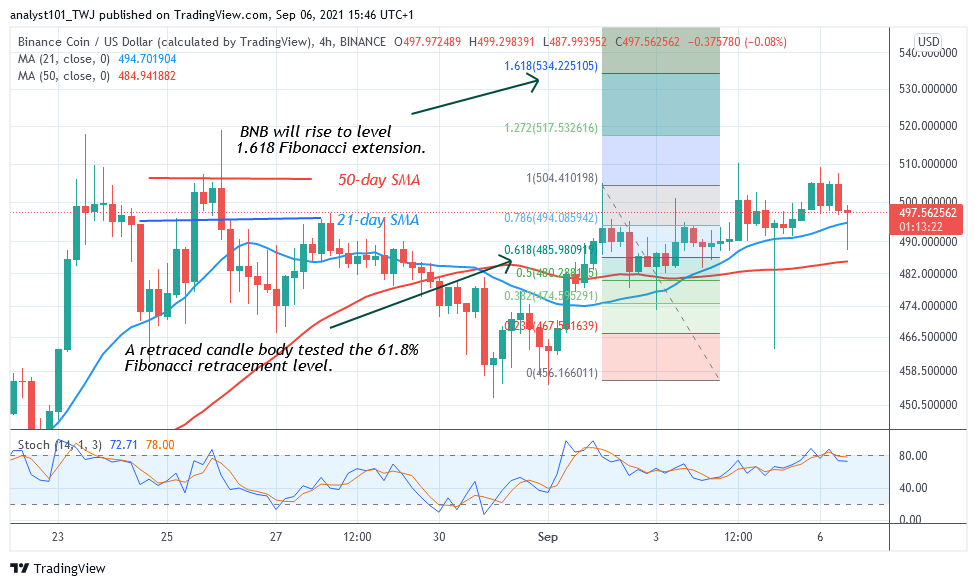
On the 4 –hour chart, the altcoin has been in a downward correction. The crypto has been struggling to break above the $510 resistance. Meanwhile, on September 2 uptrend; a retraced candle body tested the 61.8% Fibonacci retracement level. The retracement indicates that the coin will rise to level 1.618 Fibonacci extension or level $534. 22.
You can purchase crypto coins here. Buy Tokens
Note: Cryptosignals.org is not a financial advisor. Do your research before investing your funds in any financial asset or presented product or event. We are not responsible for your investing results