Bitcoin (BTC/USD) Market Holds Trendline Support Showing Signs Of Bullish Continuation
Estimated Reading Time: 3 minutes
Don’t invest unless you’re prepared to lose all the money you invest. This is a high-risk investment and you are unlikely to be protected if something goes wrong. Take 2 minutes to learn more

Bitcoin Price Prediction – June 5
Bitcoin market holds trendline support showing signs of bullish continuation. The daily chart shows bullish indications based on several technical indicators.
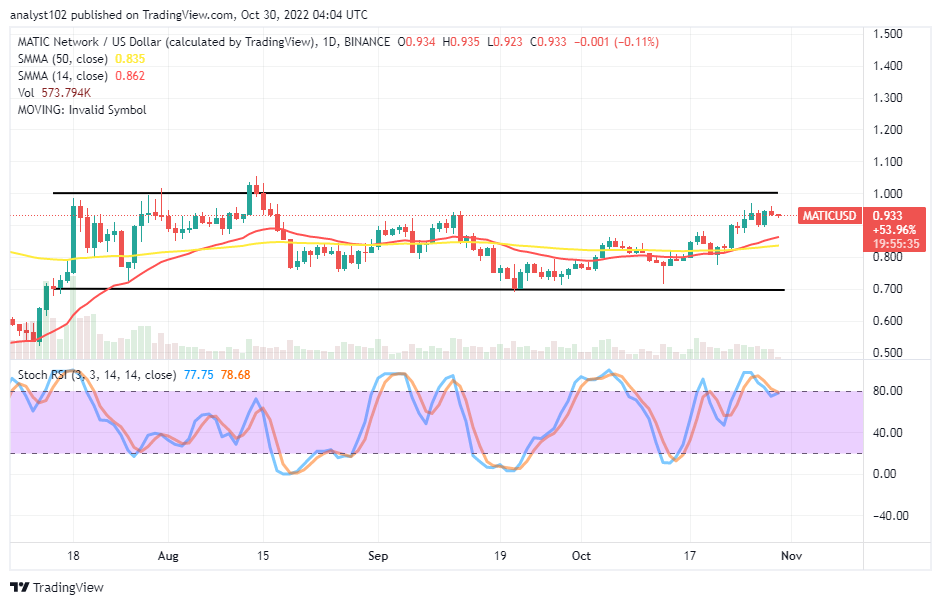
The 9-day Simple Moving Average (SMA) is currently near $105,400, slightly above the current price of around $104,740, acting as dynamic resistance. However, the price is consolidating just below this level, suggesting a possible breakout. Additionally, the Stochastic Oscillator is in the oversold zone, with the %K and %D lines at approximately 19 and 21 respectively, indicating a potential bullish crossover. This implies a likely upward momentum as buyers prepare to regain control.
BTC/USD Market Key Levels:
Resistance Levels: $108,390, $115,000, $125,000
Support Levels: $95,980, $85,010, $74,420

BTC/USD – Daily Chart
The BTCUSD daily chart shows a rebound at the trendline support as price struggles to retrace further.
BTCUSD has respected the ascending trendline support since mid-April, forming higher lows consistently. Despite the recent pullback from the high near $108,390, the price remains well-supported around $104,740.
The structure reveals a consolidation phase above key support with bullish pin bars forming near the trendline, which reflects buying pressure. The market also shows a clear breakout above the $100,700 earlier in May, adding confidence to the bullish structure.
What is the likely projection of BTCUSD?
The projection for BTCUSD remains bullish, with a potential move toward $115,000 in the short to medium term. If the price breaks above the immediate resistance levels at $105,400 and $106,140, buyers may target the next major resistance at $108,390, followed by $115,000.
A sustained move above $115,000 could open the door toward the $125,000 level. As long as the price holds above the trendline, the bullish outlook remains intact.

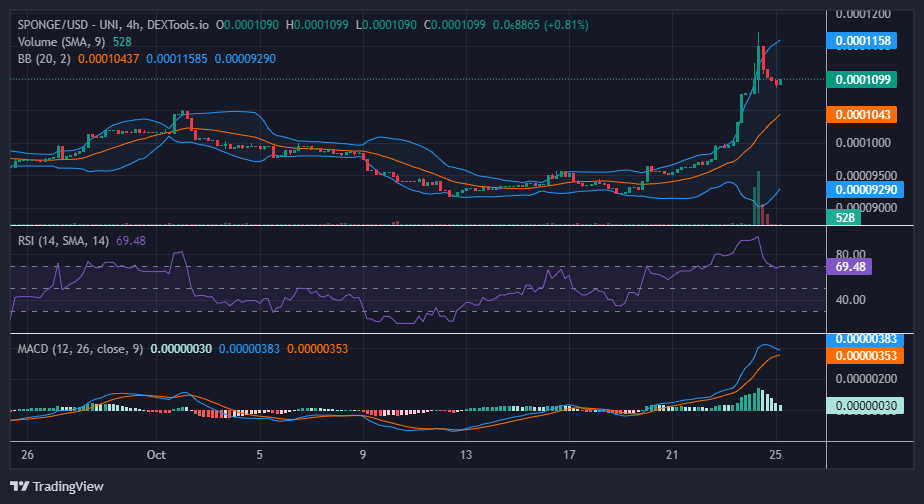
BTC/USD – Four-Hour Chart
BTCUSD on the 4-hour chart is showing signs of a bullish reversal after respecting the order block support zone around $104,000. The Stochastic Oscillator is in the oversold region, with %K and %D near 17 and 24, indicating potential upward momentum.
Price is currently consolidating just below the four-hour descending trendline and the 9-SMA at $105,150, suggesting a breakout is imminent. A successful breakout above $105,400 could open the path toward $108,390 and eventually $115,000.
Bitcoin (BTC) Current Statistics
The current price: $104,740
Market Capitalization: $2,080,000,000,000
Trading Volume: $60,130,000,000
You can purchase Bitcoin here. Buy BTC