Bitcoin Cash (BCH/USD) Price Precipitates Downward
Estimated Reading Time: 3 minutes
Don’t invest unless you’re prepared to lose all the money you invest. This is a high-risk investment and you are unlikely to be protected if something goes wrong. Take 2 minutes to learn more

Free Crypto Signals Channel
Bitcoin Cash Price Prediction – May 27
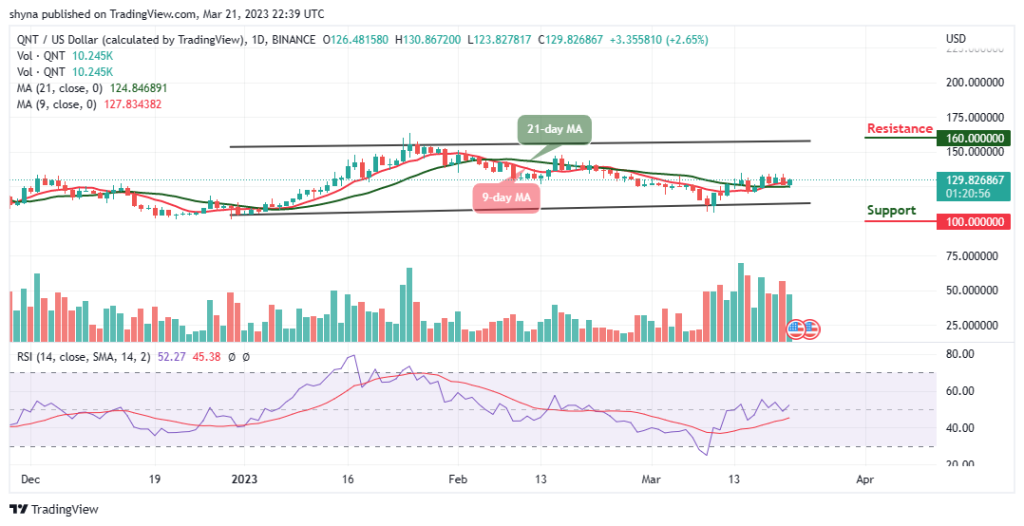
The BCH/USDbusness activity shows the crypto-economic price precipitates downward gently in a range to show bearish-trending motion isn’t yet giving a damn. The price’s percentage rate is positive at 1.90, trading around the $182 value line.
BCH/USD Market
Key Levels:
Resistance levels: $220, $270, $320
Support levels: $150, $100, $50
BCH/USD – Daily Chart
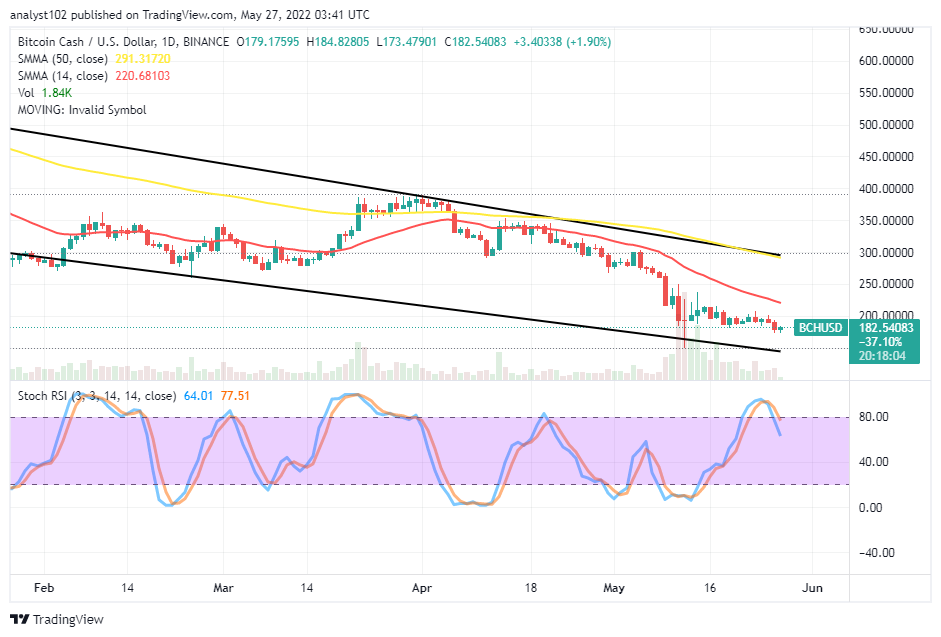
The BCH/USD daily chart shows that the crypto-economic price precipitates downward gently in a range characterized by lower lows in the process. The 50-day SMA trend line is above the 14-day SMA trend line. The Stochastic Oscillators have crossed lines southbound from the overbought region, denoting a downing movement may soon dominate the trend. The smaller bearish candlesticks can reach the $150 support level in the long run.
As the BCH/USD price precipitates downward, will it stop soon?
It may be for a while to have a trading pattern that will suggest a decent seizure of a downing process as the BCH/USD market price precipitates downward. A bullish candlestick has to emerge at a lower-trading zone of the ranging outlook so that bulls can leverage it to the upside in the course of that happening. Patients will have to exercise before achieving that scenario in the long run.
On the downside, in the BCH/USD market technical analysis, the bearish-trending path has to be continually observed alongside the smaller SMA as it bends to the south direction over the trading capacity of the crypto economy. Sellers’ positive responsiveness may dominate the market at the expense of buyers’ inactive presence, as indicated by the outward positioning of the Stochastic Oscillators’ reading.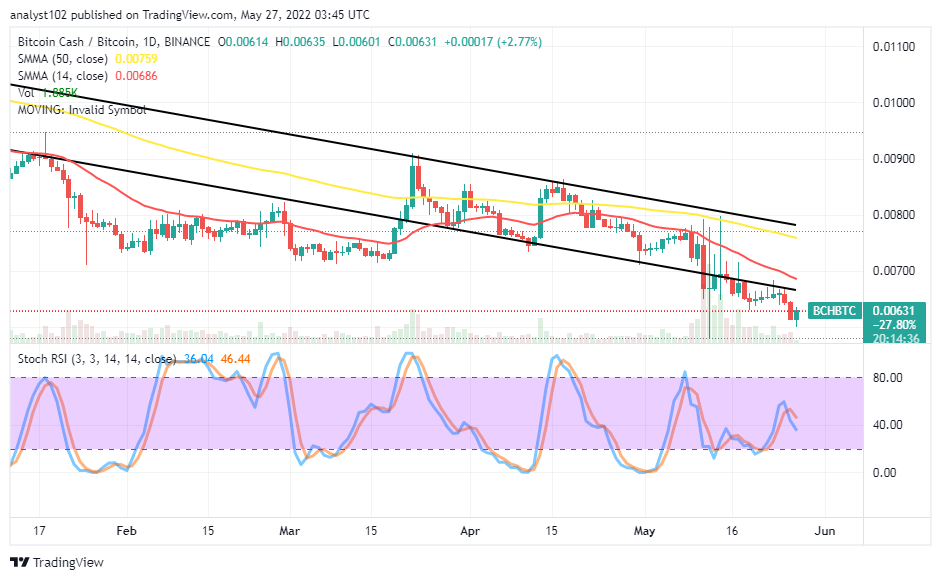
BCH/BTC Price Analysis
Bitcoin Cash market’s trending capacity to Bitcoin is trading at a shallow trading spot to denote it is still under a falling force. The cryptocurrency pair trade price precipitates downward to showcase the base trading instrument lacks the energy to against its counter underneath the smaller SMA. The 50-day SMA indicator is above the 14-day SMA indicator. The Stochastic Oscillators have crossed southbound within the range pace of 60 and 40. However, a bullish candlestick is emerging with a bottom shadow to dowse the possibility of the base crypto going down sustainably more, pairing with the trending weight of the counter crypto.
Note: Cryptosignals.org is not a financial advisor. Do your research before investing your funds in any financial asset or presented product or event. We are not responsible for your investing results.
“Lucky is up more than 50% today but still more than 430% from All Time Highs!
The opportunity to bank BIG is now!
You can purchase Lucky Block here. Buy LBlock: