Cardano Revisits the $0.78 Low as Bulls Defend Current Support
Estimated Reading Time: 3 minutes
Don’t invest unless you’re prepared to lose all the money you invest. This is a high-risk investment and you are unlikely to be protected if something goes wrong. Take 2 minutes to learn more

Free Crypto Signals Channel
Cardano (ADA) Long-Term Analysis: Bearish
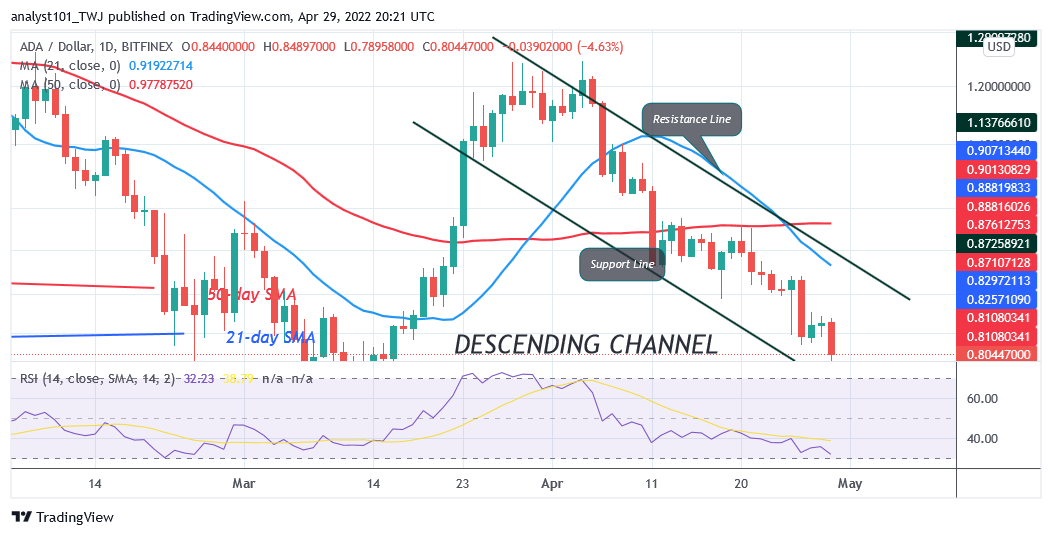
Since April 11, Cardano’s (ADA) price has fallen below the moving averages as bulls defend current support . ADA’s price fell and revisited the previous lows of February and March. In other words, Cardano fell significantly to the low of $0.78. The cryptocurrency has reached the historical price level of March. Cardano has fallen to the oversold region of the market. This current support was held in the previous price action in March. On March 14, the altcoin rebounded above the current support and rallied to the high of $1.15. Today, the current support is likely to hold as the market reaches the oversold region. However, if the bears break the current support, the market will further decline to the low of $0.74.
Cardano (ADA) Indicator Analysis
Cardano is at level 32 of the Relative Strength Index for period 14. The altcoin will reach the oversold region at level 30 of the RSI for period 14. The current price fall will soon reach bearish exhaustion. Also, ADA has a bearish crossover. That is, the 21-day line SMA crosses below the 50-day line SMA indicating a sell order. Already, ADA price is below the 20% range of the daily stochastic. It indicates that the market has reached the oversold region.
Technical indicators:
Major supply zones: $2.0, $2.20, $2.40
Major demand zones: $1.40, $1.20, $1.00
.
What Is the Next Direction for Cardano (ADA)?
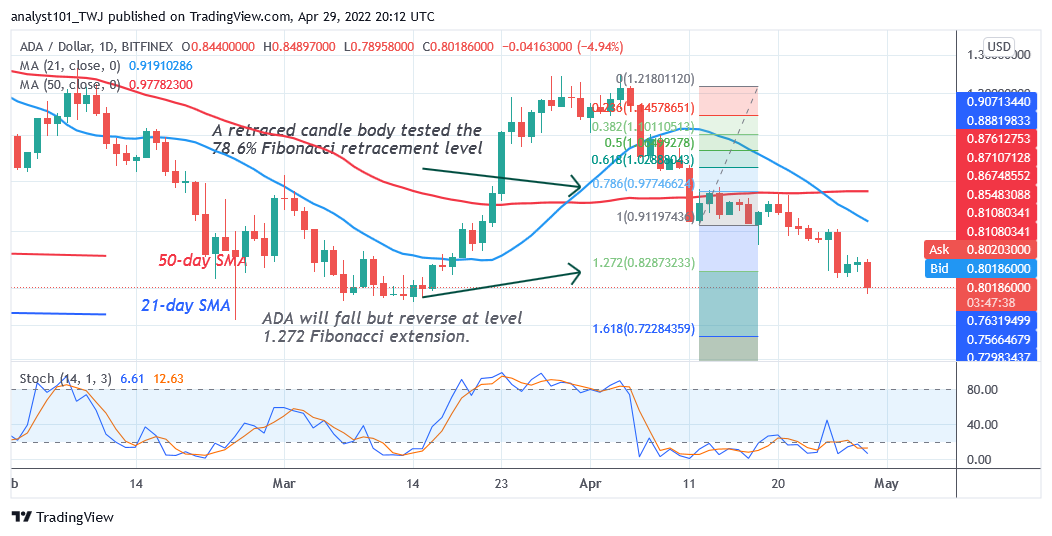
Cardano has fallen to the previous low at $0.78 as bulls defend current support . Since the market has reached the oversold region, the downtrend is likely to end. Meanwhile, on April 11 downtrend; a retraced candle body tested the 78.6% Fibonacci retracement level. The retracement suggests that ADA will fall to level 1.272 Fibonacci extension or $0.82. From the price action, the coin has fallen below the level 1.272 Fibonacci extension.
You can purchase crypto coins here. Buy LBlock
Note: Cryptosignals.org is not a financial advisor. Do your research before investing your funds in any financial asset or presented product or event. We are not responsible for your investing results