Chainlink (LINK) Consolidates Above $28, Uptrend Is Likely
Estimated Reading Time: 2 minutes
Don’t invest unless you’re prepared to lose all the money you invest. This is a high-risk investment and you are unlikely to be protected if something goes wrong. Take 2 minutes to learn more
Chainlink (LINK) Long-Term Analysis: Bearish
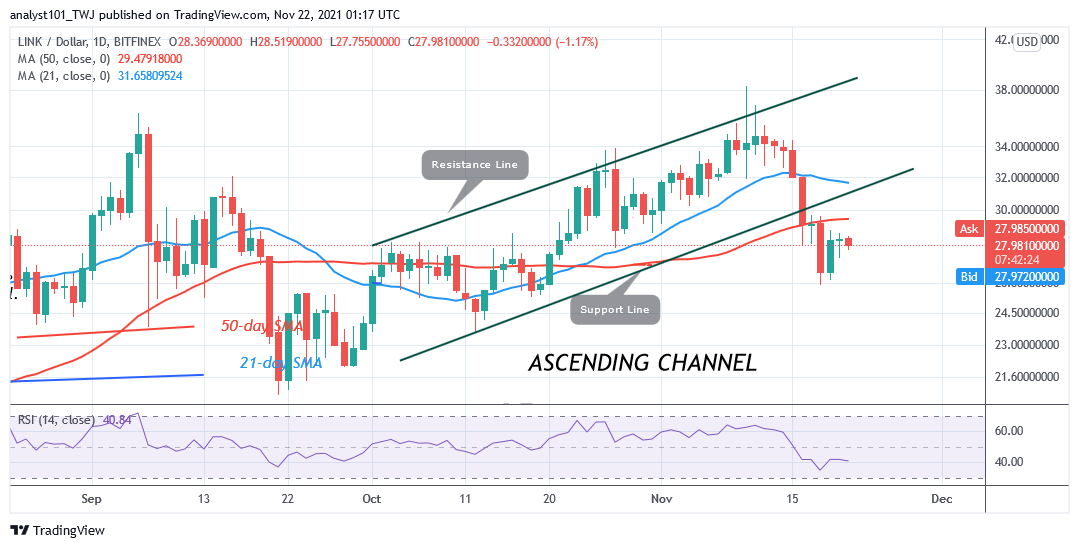
Chainlink’s (LINK) price is still trading below the moving averages indicating a further downward movement of prices. For the past three days, LINK’s price has been fluctuating between $26 and $28 price levels. If the $26 support is breached, the selling pressure will resume. The altcoin may further decline to $21 low. In the meantime, the upward correction is facing rejection at the high of $28. The retracement was because the market reached an overbought region. The current retracement has stopped as price resume fluctuation.
Chainlink (LINK) Indicator Analysis
Chainlink is at level 41 of the Relative Strength Index for period 14. The cryptocurrency has fallen to the bearish trend zone and it is capable of a further downward move. The 21-day and 50-day SMA are sloping upward indicating the uptrend. LINK is below the 80% range of the daily stochastic. The stochastic bands are sloping upward indicating an upward move.
Technical indicators:
Major Resistance Levels – $40.00, $42.00, $44.00
Major Support Levels – $26.00, $24.00, $22.00
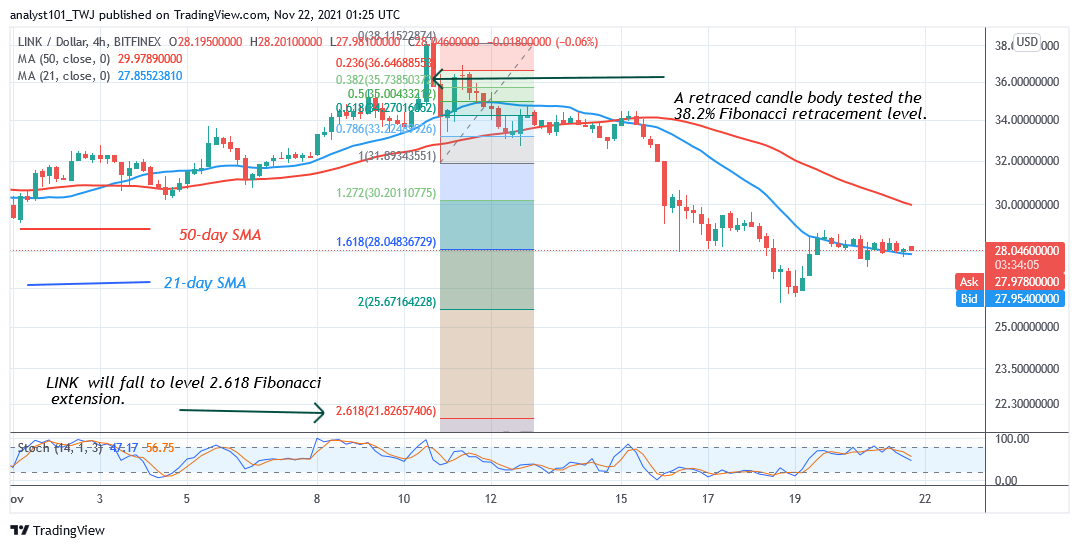
What Is the Next Direction for Chainlink (LINK)?
On the 4-hour chart, LINK is in a downward move but it consolidating above $28 support for a possible upward move. Meanwhile, on November 10 downtrend; a retraced candle body tested the 38.2% Fibonacci retracement level. The retracement indicates that LINK will fall to level 2.618 Fibonacci extensions or $21.87. From the price action, the Fibonacci tool will hold if price breaks below the $26 support.
You can purchase crypto coins here. Buy Token
Note: Cryptosignals.org is not a financial advisor. Do your research before investing your funds in any financial asset or presented product or event. We are not responsible for your investing results