Chainlink (LINK) Reaches Overbought Region, May Face Rejection at $25
Estimated Reading Time: 2 minutes
Don’t invest unless you’re prepared to lose all the money you invest. This is a high-risk investment and you are unlikely to be protected if something goes wrong. Take 2 minutes to learn more
Chainlink (LINK) Long-Term Analysis: Bearish
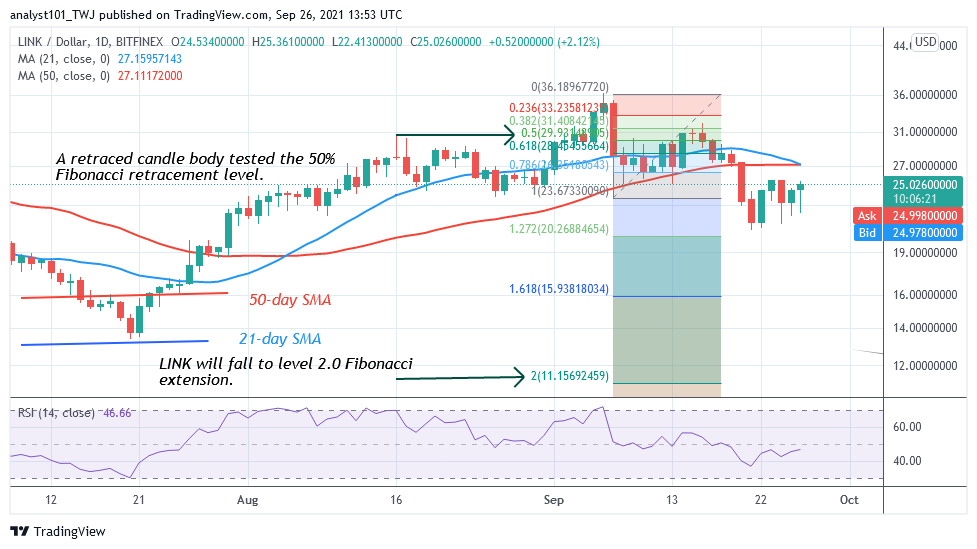
Since September 21, Chainlink’s (LINK) price has fallen to the bearish trend zone. After the bears broke below the moving averages, LINK’s price fell to the low of $20.86 as bulls bought the dips. The upward move was short-lived as the altcoin was compelled to a range-bound move. The altcoin now fluctuates between $20 and $26 price levels. Meanwhile, on September 7 downtrend, a retraced candle body tested the 50% Fibonacci retracement level. The retracement indicates that LINK will fall to level 2.0 Fibonacci extension or level $11.15.
Chainlink (LINK) Indicator Analysis
Chainlink is at level 46 of the Relative Strength Index period 14. It indicates that the altcoin is in the downtrend zone and below the centerline 50. It is trying to form a bearish crossover. The crypto is above the 80% range of the daily stochastic. The market has reached bullish exhaustion. LINK price is likely to fall.
Technical indicators:
Major Resistance Levels – $60, $62, $ 64
Major Support Levels – $30, $28, $26
What Is the Next Direction for Chainlink (LINK)?
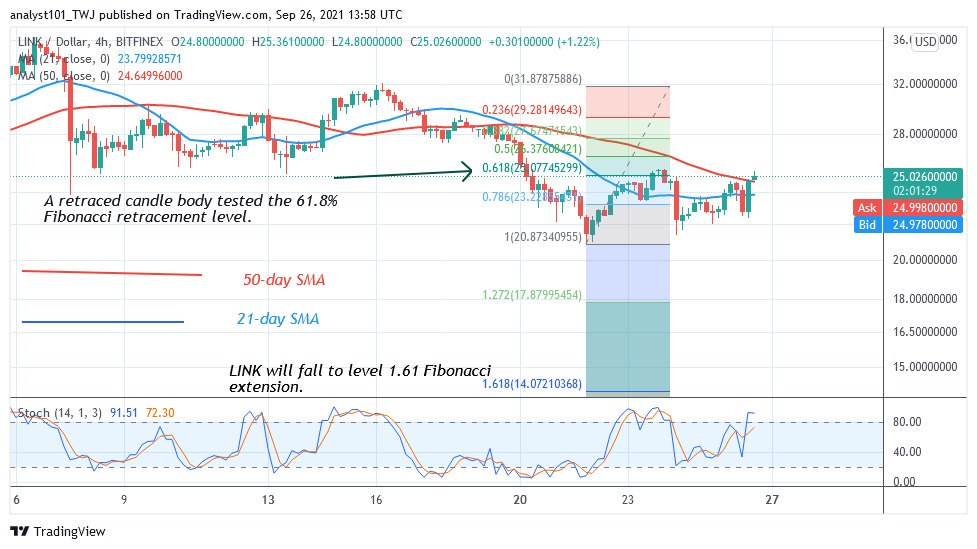
On the 4-hour chart, Chainlink has resumed an upward move as it reached the overbought region. Further upward move is doubtful as the market reaches the overbought region. Meanwhile, on September 21 downtrend; a retraced candle body tested the 61.8% Fibonacci retracement level. The retracement indicates that LINK will fall to level 1.618 Fibonacci extension or level $14.04.
You can purchase crypto coins here. Buy Tokens
Note: Cryptosignals.org is not a financial advisor. Do your research before investing your funds in any financial asset or presented product or event. We are not responsible for your investing results