Compound (COMPUSD) Approaches Potential Reversal Zone
Estimated Reading Time: 3 minutes
Don’t invest unless you’re prepared to lose all the money you invest. This is a high-risk investment and you are unlikely to be protected if something goes wrong. Take 2 minutes to learn more
Market Analysis – COMPUSD Could Execute a Potential Reversal at The $505.0 Zone
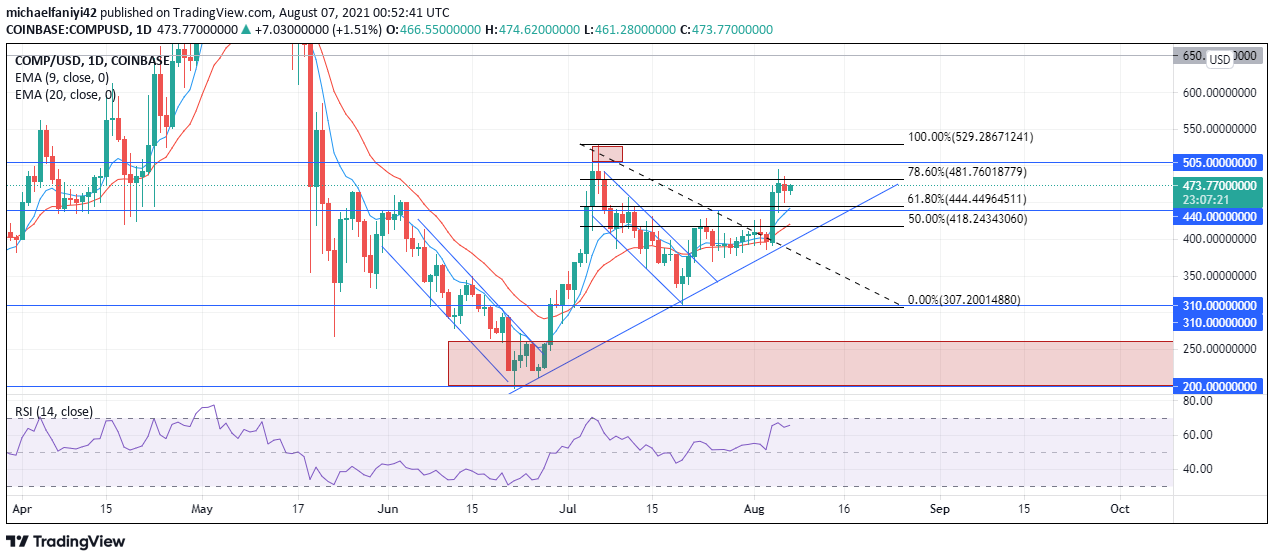
A potential reversal zone is being approached by COMPUSD. Its bullish break out from its consolidation zone at $440.0 might be false. Before the break out above the $440.0 level, which happened on the 4th of August 2021, the coin had been consolidating for ten to twelve days, offering no specific direction to retail investors. This was the case until an impulse pumped the price above the resistance level that held it bound. However, despite this seemingly bullish break-out, COMPUSD seems to be heading towards a potential reversal zone. A bearish market model could be just around the corner.
Key Levels
Resistance Levels: $505.0, $650.0
Support Levels: $440.0, $310.0, $200.0
The $505.0 level happens to be the important potential reversal zone. This is a level where price retested on 6th July 2021 and sold off massively before finding support at $310.0 to begin to buy again. As price approaches this zone again, we can begin to observe some bearish markings on the chart which point to a potential reversal. This is despite the bullish breakout that happened.
Observing the RSI (Relative Strength Index), we see price approaching the 70.00 overbought zone, indicating that market bullishness might just be on its last legs. Historically, if we look to the left of the RSI, we will notice the last time price approached this same overbought zone, the market sold from there.
Plotting the Fibonacci tool from the coin’s most recent market structure range, it coincides finely. The potential reversal zone is at the Fib’s 78% optimal entry point. These aligning factors simply indicate a renewed bearish run might be around the corner, upon price reaching the $505.0 zone.

Market Prospects
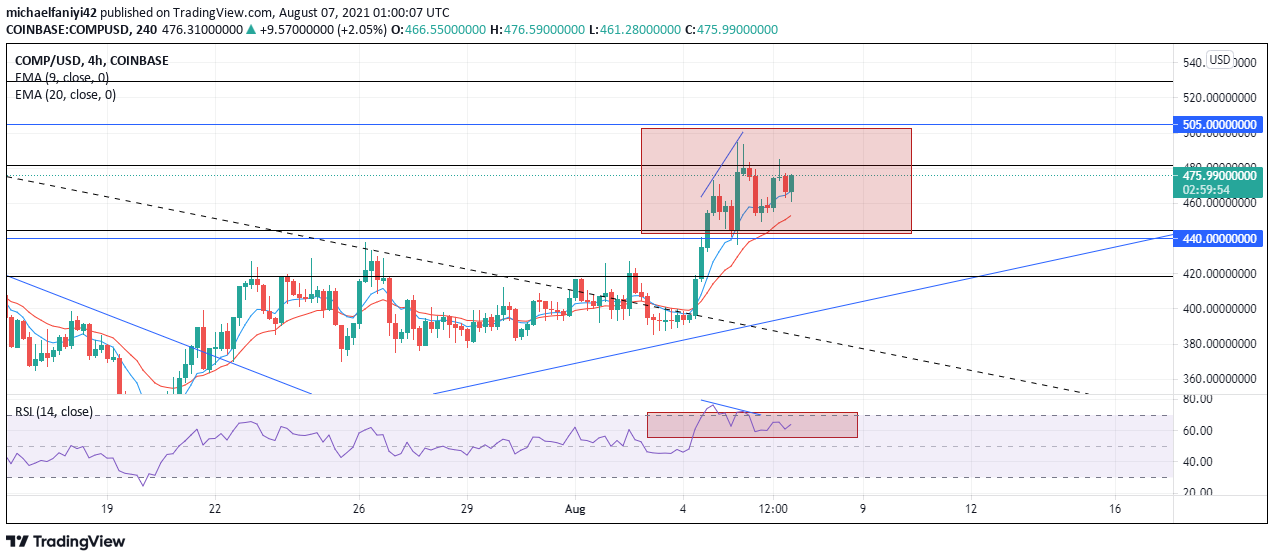
The 4H chart also supports the potential reversal notion. Observing the RSI indicator on this timeframe, we see a divergence occur between the price on the chart and the RSI. This is because price made a higher high while the RSI refused to correspond, rather, making a lower high. This is a classic bearish divergence pattern between price and the RSI indicator. Traders can therefore be on the lookout for opportunities to join the sell-side once price reaches $505.0 and react accordingly.
When price reacts to the potential reversal zone of $505.0 and begins to sell, we can expect the bears to aggressively drive price towards violating the support levels at $310.0 and $200.0. However, should the coin defile these odds and sustain the bullish run, this would restore investors’ confidence in it and we could see price reach the $650.0 level. This would be a good recovery point for long-term holders of the coin.
You can purchase crypto coins here: Buy Tokens
Note: Cryptosignal.org is not a financial advisor. Do your research before investing your funds in any financial asset or presented product or event. We are not responsible for your investing results.