Compound (COMPUSD) Besieges the Weekly Resistance at $50
Estimated Reading Time: 2 minutes
Don’t invest unless you’re prepared to lose all the money you invest. This is a high-risk investment and you are unlikely to be protected if something goes wrong. Take 2 minutes to learn more

Free Crypto Signals Channel
COMPUSD Analysis – The Market Besieges the $50 Price Level
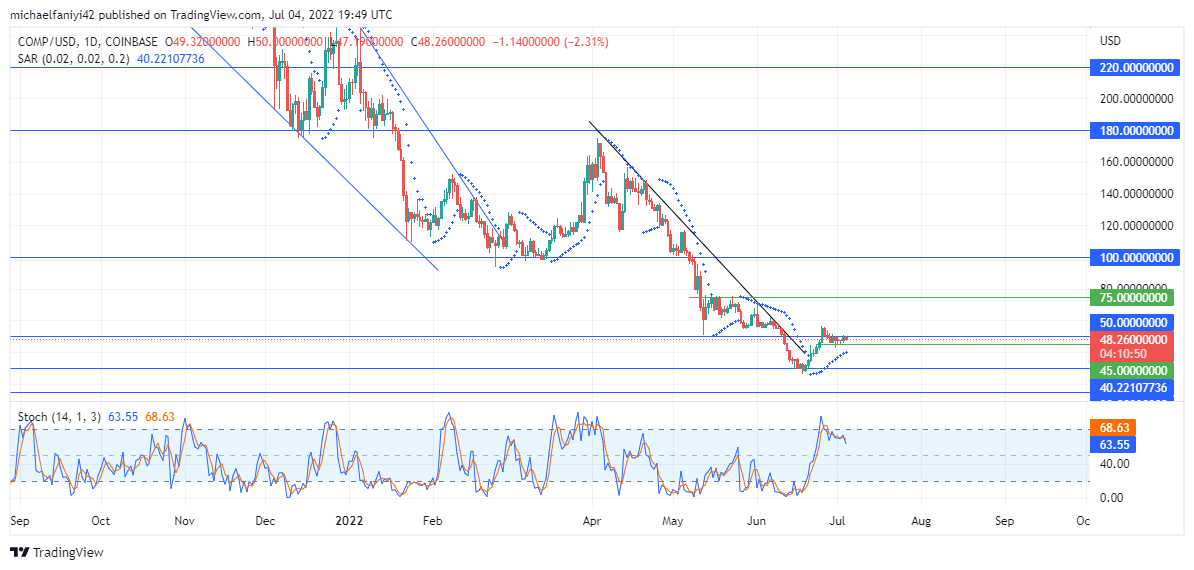
Compound besieges the $50 weekly resistance level to push for more upside movement. Before doing this, the price rebounds impressively from the $30 support level with consecutive bullish candlesticks. This led to the quick break of the resistance at $50, but the market was overpowered and sent below the resistance level. The market now besieges the resistance to force its way upward.
Compound Key Zones
Resistance Zones: $75, $50
Support Zones: $45, $30
The market is in a steady downtrend. For each key level the price drops to, there is always a tendency for the ranging of the market. After a period of accumulation, the bears take over and plunge the market again to the next support, and then the cycle repeats itself again. Presently, the coin has dropped to $30 and the trend is about to repeat itself.
However, the bulls seem more aggressive, pushing hard at the resistance, which is at $50. A false breakout had even occurred before the price was curtailed. Now the price besieges the same $50 resistance ready to drill through. The aggressiveness of the bulls seems to be unmatched, as in previous levels. The Parabolic SAR (Stop and Reverse) confirms the aggressiveness of the bulls with dots below the daily candles.

Market Expectations
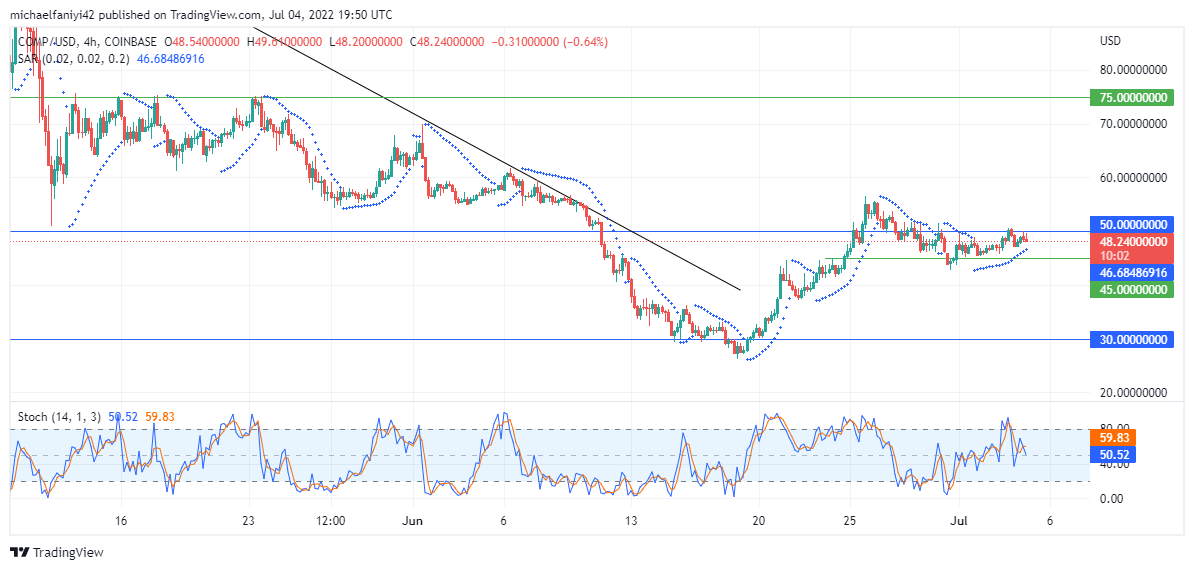
On the 4-hour chart, the price is leveraging the $45 price level as support to besiege the resistance level. Presently, like on the daily chart, the Parabolic SAR has its dots below the candlesticks on the 4-hour charts. Correspondingly, the Stochastic Oscillator line has just risen into the overbought region. The price will likely drop back to $45 for another drive at the $50 level.
How To Buy Lucky Block
Note: Cryptosignals.org is not a financial advisor. Do your research before investing your funds in any financial asset or presented product or event. We are not responsible for your investing results.