Compound (COMPUSD) Is Consolidating Between Two Key Levels
Estimated Reading Time: 3 minutes
Don’t invest unless you’re prepared to lose all the money you invest. This is a high-risk investment and you are unlikely to be protected if something goes wrong. Take 2 minutes to learn more
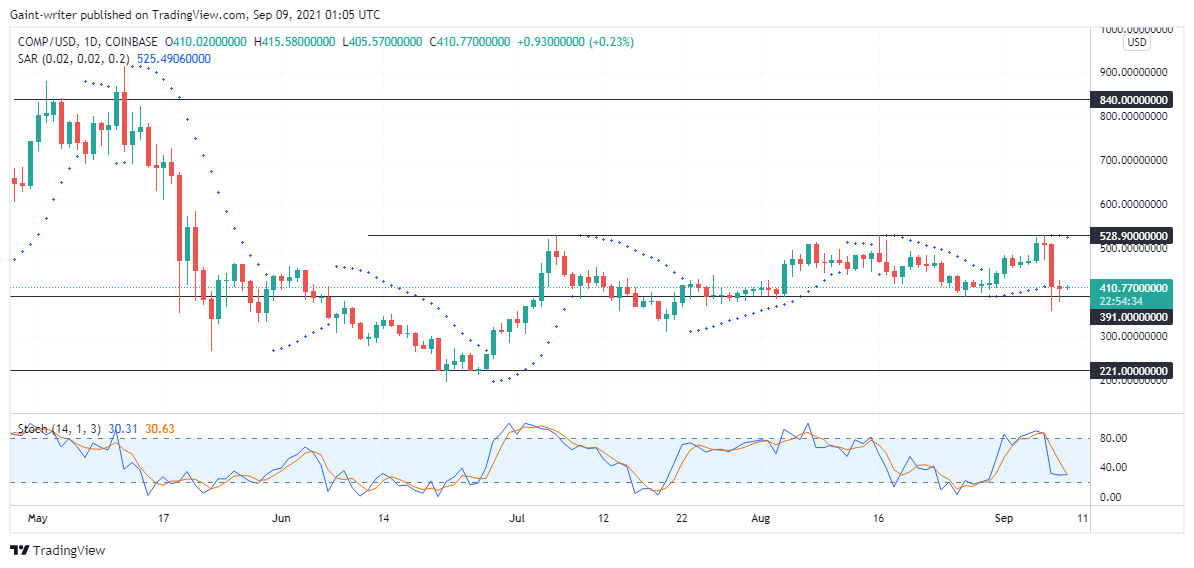
Market Analysis – COMPUSD Is Consolidating Between the $528.90 and the $391.00 Key Levels
COMPUSD is consolidating between two key levels as the market continues to move in a sideways movement. As the bulls and bears continue to trade power, there are multiple price accumulations at this level. As a result of this impact, there is only a simple tweak since the price continues to react at the same levels. Following the accumulation phase, the price will either continue in a downtrend by breaking through the $391.00 significant level, or it will move in the other direction to continue in an uptrend.
COMPUSD Significant Zones
Resistance Levels: $840.00, $528.90
Support Levels: $391.00, $221.00
The market first formed a new high after the price rallied toward the $840.00 significant key level. However, the price retested this zone twice before a sharp turnaround. There was a sharp liquidity run as the price fell below $391.00000000. There was also a retest at this level, with the price dropping to $221.00 before shifting direction.
However, the market gained bullish momentum after breaking over the $391.00 pivotal barrier to retest the $528.90 significant key level. COMPUSD will then continue to consolidate as the price reacts to these two levels. On the daily chart, the market is seen forming across near to the oversold area on the Stochastic Oscillator after a strong run from the $528.900 key level. This indicates a reversal within the range. As a result, the market will gain bullish momentum and hit a key level of $528.90.

Market Expectations
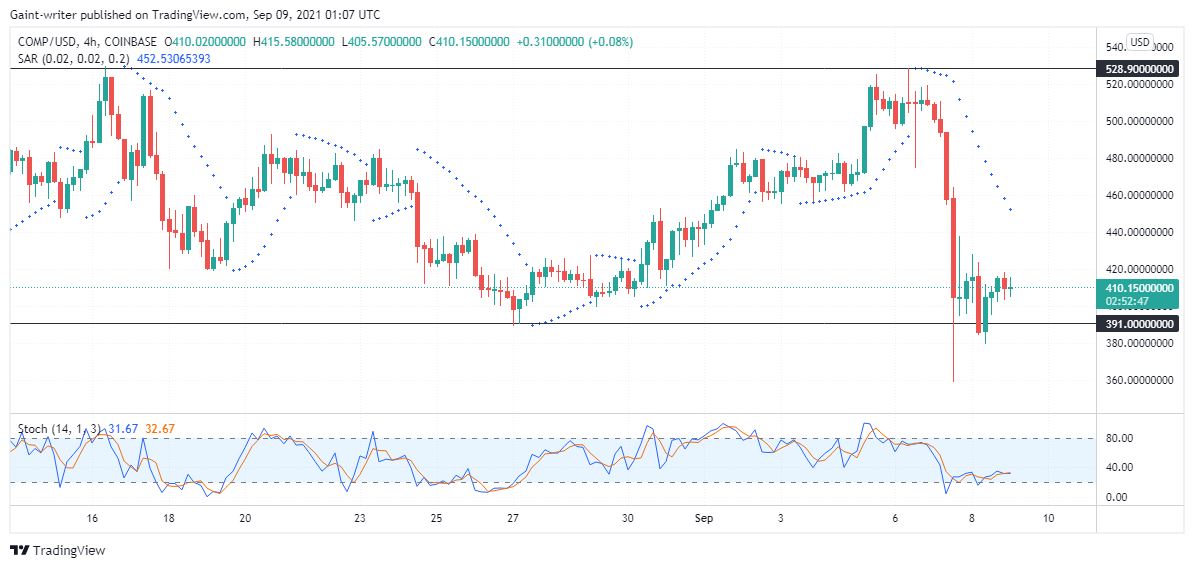
On the 4hr chart, the price began to rise after rapid liquidity run from the $528.90 significant level to the $391 key level. Following that, there was a pullback as the market returned to retest this level. This suggests that the price will develop bullish momentum to fill in those gaps. The Stochastic Oscillator indicator indicates a shift in direction when it passes towards the overbought area. However, the Parabolic SAR (Stop and Reverse) displays a downward trend of dots, indicating the market’s primary trend. The price is then expected to rise to the $528.90 important level before continuing or reversing.
You can purchase crypto coins here: Buy Tokens
Note: Cryptosignals.org is not a financial advisor. Do your research before investing your funds in any financial asset or presented product or event. We are not responsible for your investing results.