Compound (COMPUSD) Retraces but Still Sustains Its Bearish Tendency
Estimated Reading Time: 3 minutes
Don’t invest unless you’re prepared to lose all the money you invest. This is a high-risk investment and you are unlikely to be protected if something goes wrong. Take 2 minutes to learn more
COMPUSD Analysis – Price Sustains Its Tendency for Bearish Movement
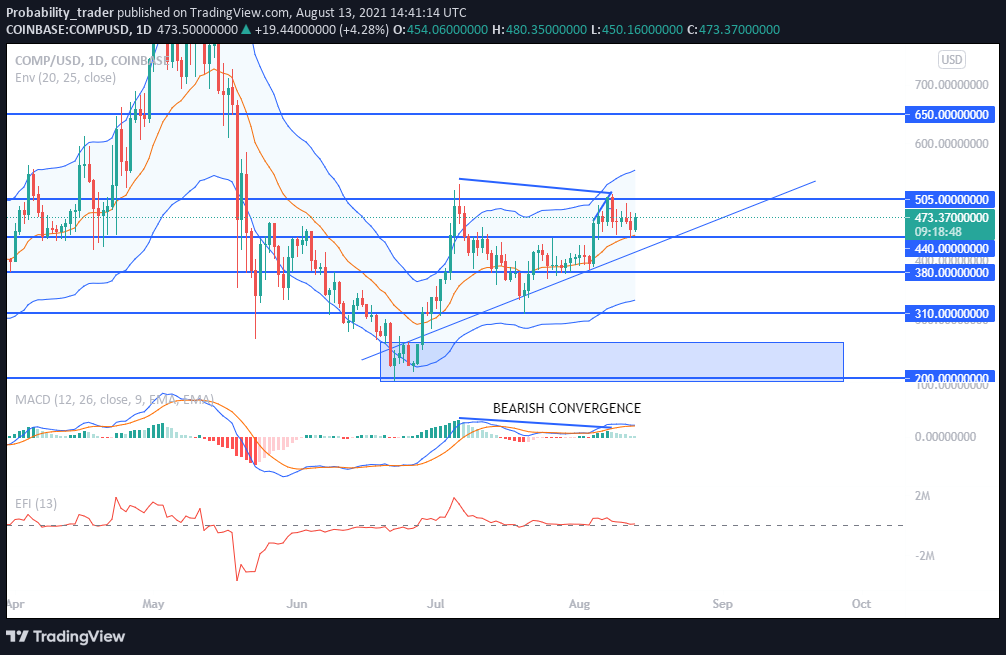
COMPUSD sustains its bearish tendency by selling off at the $505.0 price level. This bearish run began on the 8th of August 2021, when the market hit $505.0. This level was the potential reversal point highlighted in a previous analysis, and when price reached this level, the market formed a Head and Shoulder pattern on the chart and sold 12% of the coin’s value in a five-day move.
COMPUSD Key Levels
Resistance Levels: $505.0, $650.0
Support Levels: $440.0, $310.0,
The COMPUSD chart still looks primed with a lot of bearish tendencies and potential. Firstly, the price is forming a bearish convergence on the daily chart. COMPUSD made a higher low and the MACD volume indicator also made a higher low, revealing to us that the bulls appeared to have lost their strength to keep the price up as bullish volume is relatively low.
Also, the EMA (Exponential Moving Average) 12 & 26 on the MACD are at a cross point. The blue EMA is looking to cross the red EMA to the downside, indicating incoming bearishness. Plotting the EFI (Elder Force Index) on the chart, we observe that the red force line has started losing momentum to stay up and the line has started to point downwards towards the zero mark, as if to break it to the downside.
Market Prospects
The 4-hour chart confirms the bearish tendency of COMPUSD with some major patterns. Firstly, is the highlighted bearish divergence that was formed when price made a higher high during the rally from the 5th-7th of August. The MACD EMA, however, formed a lower low. This indicates weakness in the bullish move and that the bulls are withdrawing from the market at this point.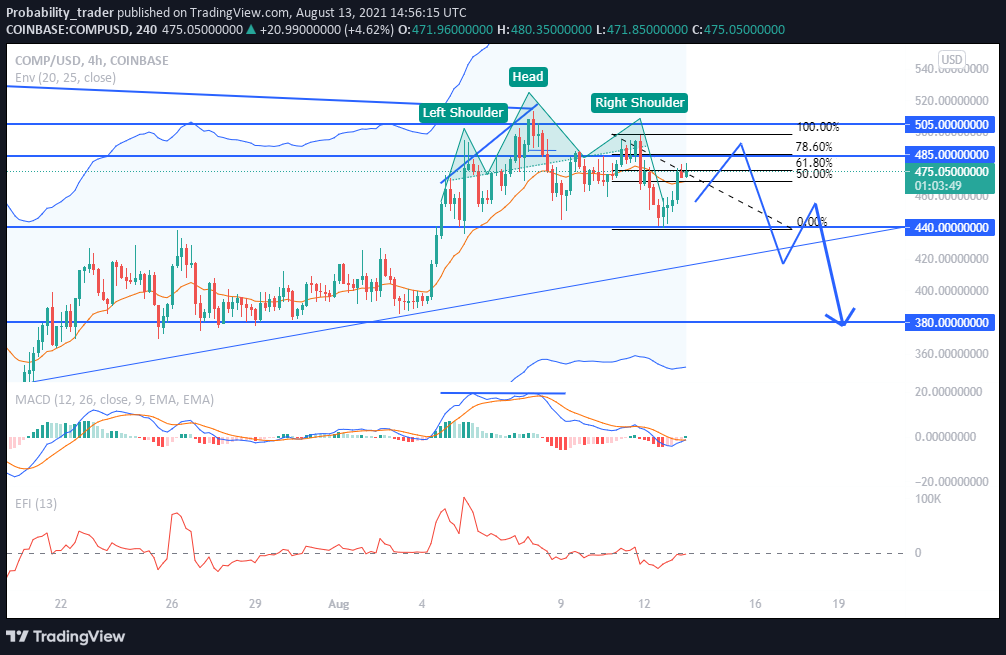
Furthermore, the head-and-shoulders pattern has been formed on the 4-hour timeframe. The Head and Shoulder is a reliable major trend pattern, and its appearance on the 4-hour chart shows the market is prepped to sustain the bearish move. An ideal entry point to place our short position would be the 78% (optimal entry point) of the Fibonacci at $485.0, plotted from the most recent market structure range formed.
Should COMPUSD trade into the optimal entry point, sustain its bearish tendency and begin to fall, we can expect price to take out the support levels at $440, $380, $310 and convert them to future resistance zones.
You can purchase crypto coins here: Buy Tokens
Note: Cryptosignal.org is not a financial advisor. Do your research before investing your funds in any financial asset or presented product or event. We are not responsible for your investing results.