DeFi Coin Price Prediction: DEFC/USD Bulls Will Surface after Moving Sideways
Don’t invest unless you’re prepared to lose all the money you invest. This is a high-risk investment and you are unlikely to be protected if something goes wrong. Take 2 minutes to learn more

Free Crypto Signals Channel
The DeFi Coin price prediction is facing moderate volatility as the coin prepares to head to the upside to gain more bullish movements.
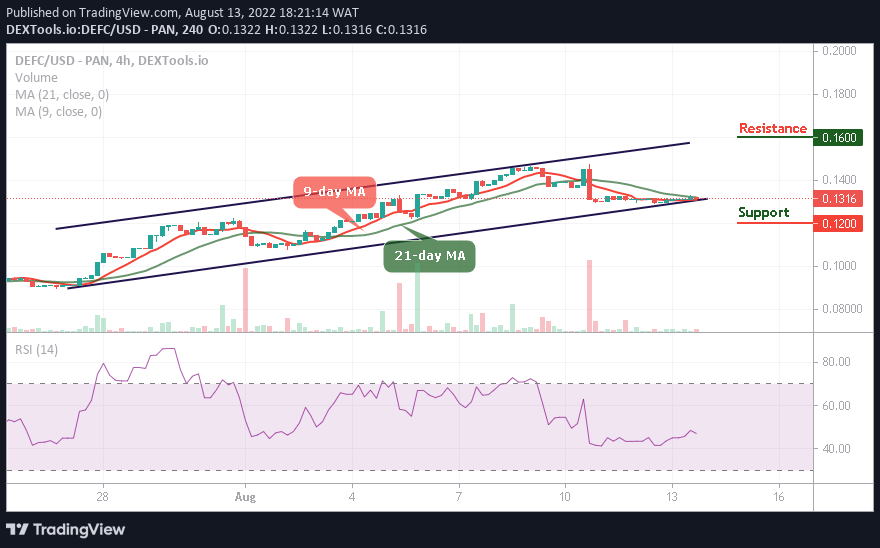
DEFC/USD Long-term Trend: Ranging (4H Chart)
Key Levels:
Resistance levels: $0.16, $0.18, $0.20
Support levels: $0.12, $0.10, $0.08
DEFC/USD is trading around the $0.13 level within the 9-day and 21-day moving averages. In the range of the ascending channel, the closest support could be located below the lower boundary of the channel. Meanwhile, if the market increases, additional resistance can be found at the $0.14 level.
DeFi Coin Price Prediction: DEFC Price Could Retreat Before Heading to the Upside
The DEFC price is going to create a bullish movement as the coin prepares to cross above the 21-day moving average, but the technical indicator Relative Strength Index (14) remains below the 50-level for more buyers to enter the market.
Nevertheless, as the DeFi Coin hovers around the moving averages, it will spike to the upside and could hit the resistance level of $0.14. However, any little retreat to the south could hit the support levels of $0.12, $0.10, and $0.08, while crossing above the channel will touch the resistance levels at $0.16, $0.18, and $0.20 respectively.
DEFC/USD Medium-term Trend: Ranging (2H Chart)
The DeFi Coin remains above the 9-day and 21-day moving averages as the coin could hit the nearest resistance level of $0.14. DEFC/USD will soon break to the upside if the bulls can keep the coin above the moving averages.
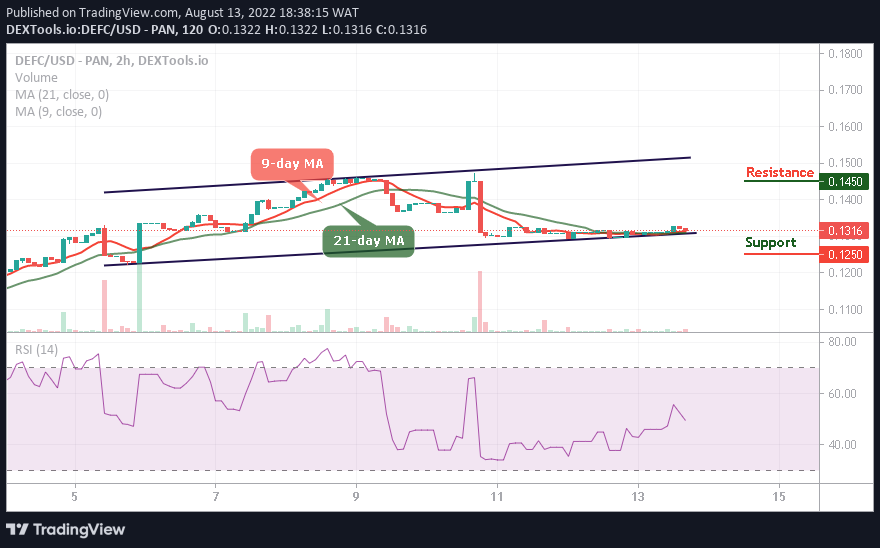
In other words, if the DEFC price crosses below the lower boundary of the channel, DEFC/USD may create a new low that could touch the support level of $0.125 and below. Meanwhile, any bullish movement above the channel will allow the market to form a new upward trend, and this could hit the potential resistance level at $0.145 and above.
You can purchase DeFi Coin here. Buy DEFC