DeFi Coin Price Prediction: DEFC/USD Ranges: More Buyers to Come Into Focus
Estimated Reading Time: 2 minutes
Don’t invest unless you’re prepared to lose all the money you invest. This is a high-risk investment and you are unlikely to be protected if something goes wrong. Take 2 minutes to learn more

Free Crypto Signals Channel
The DeFi Coin price prediction shows that DEFC would begin to form higher as the coin heads toward the moving averages.
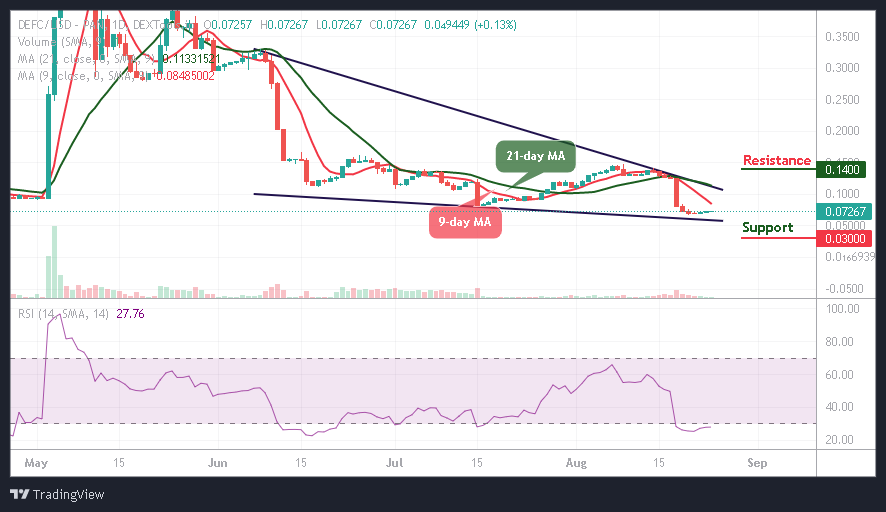
DEFC/USD Medium-term Trend: Ranging (1D Chart)
Key Levels:
Resistance levels: $0.14, $0.16, $0.18
Support levels: $0.03, $0.02, $0.01
DEFC/USD is trading below the 9-day and 21-day moving averages as the bulls are getting ready to push the coin to the upside. The DeFi Coin price may consolidate a little to allow more buyers to come into focus.
DeFi Coin Price Prediction: Green Days Are Coming for DEFC/USD
The DeFi Coin price would break above the 9-day moving average as soon as the coin touches the resistance level of $0.10. Therefore, any further bullish movement above the upper boundary of the channel may hit the potential resistance levels at $0.14, $0.16, and $0.18.
Nevertheless, this technical analysis may be delayed if the bears bring the price below the lower boundary of the channel and could fall to the support levels of $0.03, $0.02, and $0.01. Moreover, the technical indicator Relative Strength Index (14) is still within the oversold region preparing the coin for the bullish movement.
DEFC/USD Medium-term Trend: Ranging (4H Chart)
According to the 4-hour chart, the DeFi Coin price is moving sideways, and it will head to the north as soon as the coin gain enough momentum. However, the long-term moving averages may keep the bullish movement as the market prepares for a new trend.
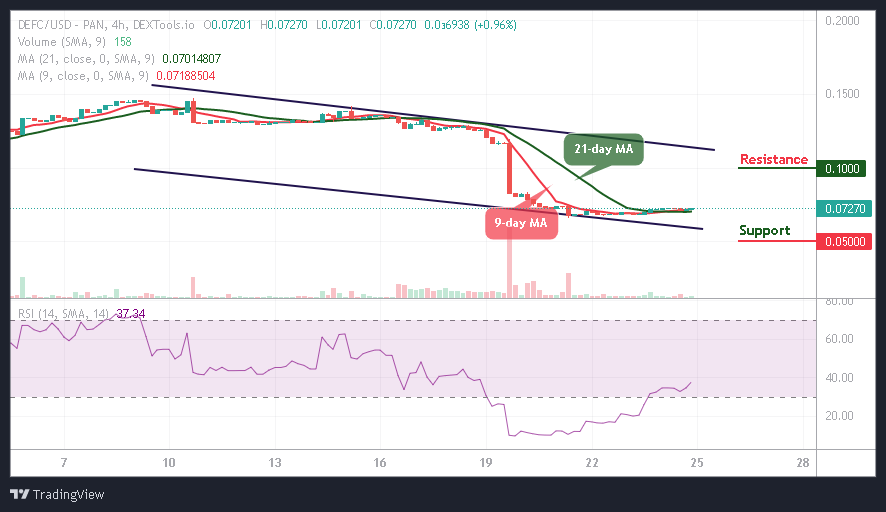
On the other hand, if the buyers push the price above the resistance level of $0.09; higher resistance would be located at $0.10 and above. Moreover, the technical indicator Relative Strength Index (14) is moving to cross above the 40-level, and should the bulls fail to move the current market value up, the bears may step into the market, and the nearest support level could be found at $0.05 and below.
You can purchase DeFi Coin here. Buy DEFC