DeFi Coin Price Prediction: DEFC/USD Sets to Touch $0.080 Resistance
Estimated Reading Time: 3 minutes
Don’t invest unless you’re prepared to lose all the money you invest. This is a high-risk investment and you are unlikely to be protected if something goes wrong. Take 2 minutes to learn more

Free Crypto Signals Channel
The DeFi Coin price prediction shows that DEFC is getting ready to move to the upside as the coin hovers around the $0.074 level.
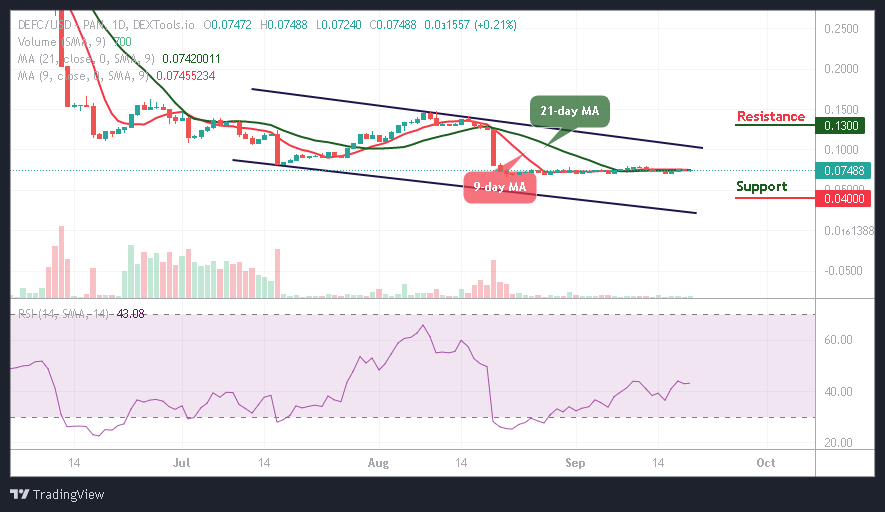
DEFC/USD Long-term Trend: Ranging (1D Chart)
Key Levels:
Resistance levels: $0.13, $0.15, $0.17
Support levels: $0.04, $0.03, $0.02
DEFC/USD could hit the $0.080 resistance level in the next positive movement. The difficult period seems to be over for this crypto as it tries to focus on the upside. However, the DEFC price is currently trading at $0.074, it could probably retest below this level again before it rises higher.
DeFi Coin Price Prediction: DEFC Price Ready for the Higher Levels
The DEFC price is moving to cross above the 9-day and 21-day moving averages. A break above this barrier could encourage more buyers to increase their entries, which could eventually push the price to hit the resistance levels of $0.13, $0.15, and $0.17. On the downside, once the price breaks below the moving averages, the sell-off could gain traction with the next focus on the lower boundary of the channel.
Moreover, if the support level of $0.05 is broken, the downside pressure may increase while the next supports may be created around $0.04, $0.03, and $0.02 respectively. The technical indicator Relative Strength Index (14) is likely to remain above the 40-level, to give additional bullish signals.
DEFC/USD Medium-term Trend: Ranging (4H Chart)
The DeFi Coin is moving to cross above the 9-day and 21-day moving averages as the coin range bounds. However, a close above the resistance level of $0.075 will encourage the bulls to extend the rally towards the resistance level of $0.080 and above.
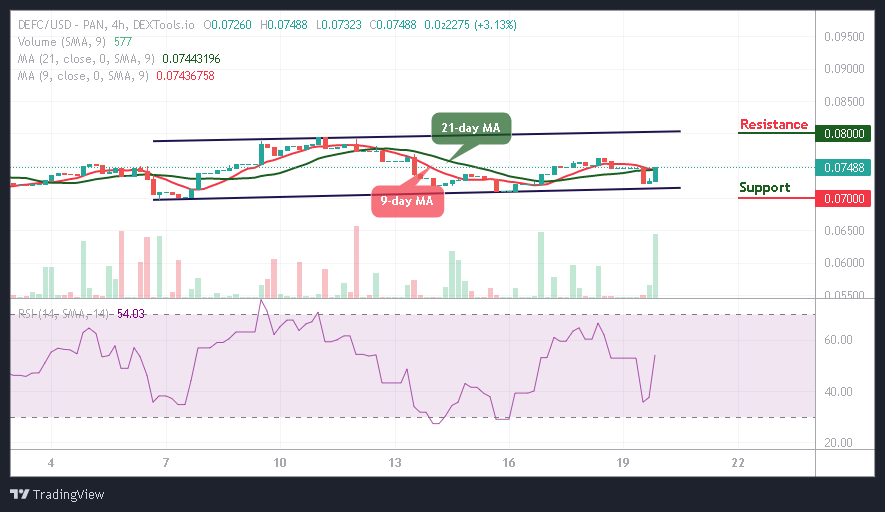
On other hand, a drop below the lower boundary of the channel could reverse the DEFC price and a further bearish movement could take the coin to the support level of $0.07 and below. Meanwhile, there is a possibility that the DeFi coin will begin the upward movement as the technical indicator Relative Strength Index (14) moves above 50-level with the signal line pointing to the north.
You can purchase DeFi Coin here. Buy DEFC