DeFi Coin Price Prediction: DEFC/USD Sets to Touch $0.10 Level
Estimated Reading Time: 2 minutes
Don’t invest unless you’re prepared to lose all the money you invest. This is a high-risk investment and you are unlikely to be protected if something goes wrong. Take 2 minutes to learn more

Free Crypto Signals Channel
The DeFi Coin price prediction shows DEFC getting ready to head towards the 9-day moving average as the coin trades bullishly.
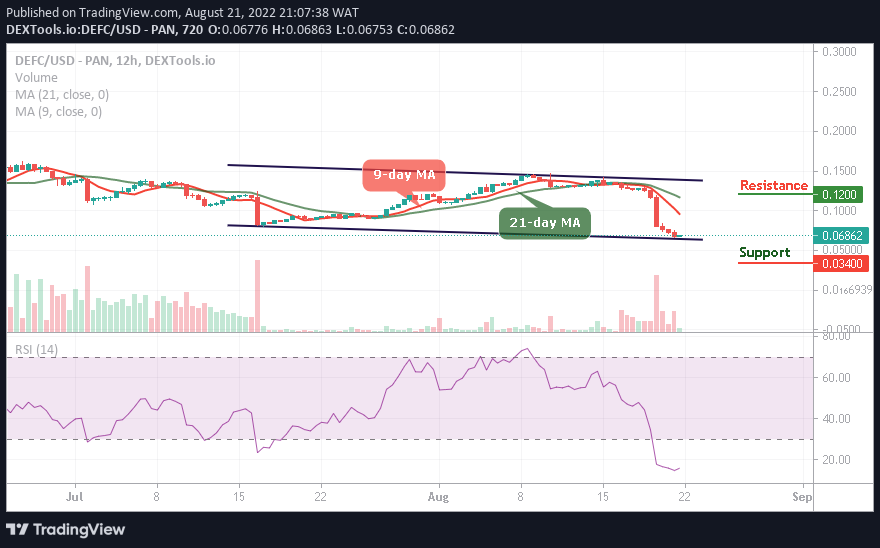
DEFC/USD Long-term Trend: Ranging (12H Chart)
Key Levels:
Resistance levels: $0.12, $0.14, $0.16
Support levels: $0.03, $0.02, $0.01
DEFC/USD is at the time of writing heading to hit the $0.10 resistance level as the coin moves toward the 9-day moving average. However, the DEFC price is currently trading at $0.068, although the coin is moving bullishly, it could probably retest the $0.110 level before rising higher.
DeFi Coin Price Prediction: DEFC Price Will Head to the Upside
The DEFC price is moving towards the 9-day moving average as a break above this barrier could encourage the existing buyers to gain more and the new buyers to enter the market. If the bullish movement continues, DEFC/USD could hit the resistance levels of $0.12, $0.14, and $0.16 respectively. On the downside, if the price breaks below the lower boundary of the channel, the downside pressure may increase as the next supports may be created around $0.03, $0.02, and $0.01. The technical indicator Relative Strength Index (14) is moving within the oversold region, preparing for the bullish movement.
DEFC/USD Medium-term Trend: Bearish (4H Chart)
The DeFi Coin is moving to cross above the 9-day moving average as the coin range bounds. However, a close above the resistance level of $0.07 will encourage the bulls to extend the rally towards the resistance level of $0.10 and above.
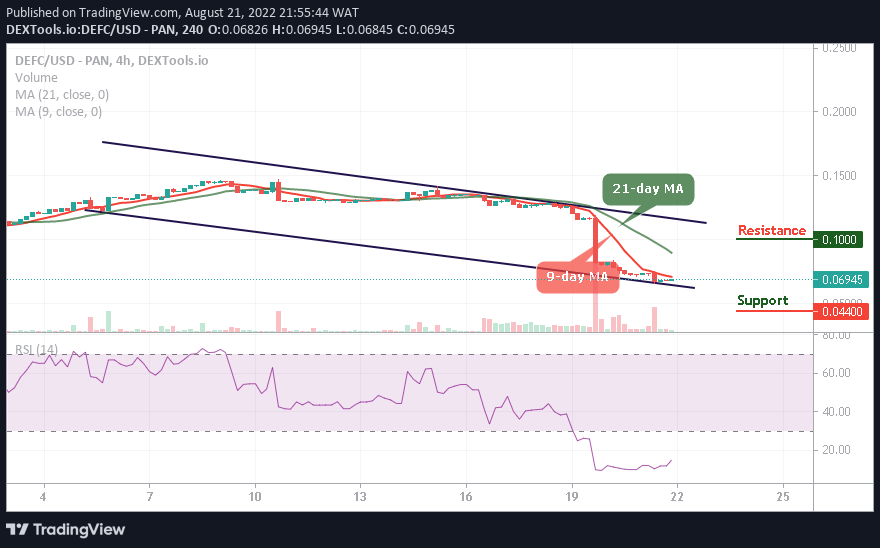
However, a drop below the lower boundary of the channel could reverse the DEFC price, and a further bearish movement could take the coin to the support level of $0.04 and below. Meanwhile, there is a possibility that the DeFi coin will begin the upward movement as the technical indicator Relative Strength Index (14) prepares to move out of the oversold region.
You can purchase DeFi Coin here. Buy DEFC