DeFi Coin Price Prediction: DEFC/USD Trades Around $0.072 Level
Estimated Reading Time: 3 minutes
Don’t invest unless you’re prepared to lose all the money you invest. This is a high-risk investment and you are unlikely to be protected if something goes wrong. Take 2 minutes to learn more

Free Crypto Signals Channel
The DeFi Coin price prediction shows that DEFC is yet to display a significant bullish move as the market may move sideways before moving higher.
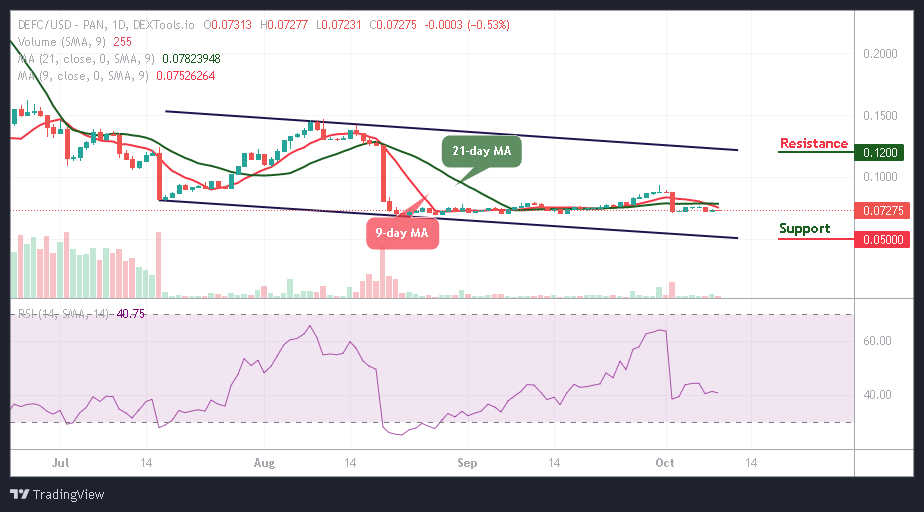
DEFC/USD Medium-term Trend: Ranging (1D Chart)
Key Levels:
Resistance levels: $0.12, $0.13, $0.14
Support levels: $0.05, $0.04, $0.03
DEFC/USD is trading below the 9-day and 21-day moving averages as the price moves to touch the resistance level of $0.14. The market price is moving sideways while the coin is getting ready for the upside. Meanwhile, DEFC/USD remains in an unstable market as a price surge is more likely to play out.
DeFi Coin Price Prediction: DEFC Price Would Surge to the Upside
The DeFi Coin price remains intact, and for an upsurge to play out, DEFC/USD needs to cross above the 9-day and 21-day moving averages, which may cause the coin to hit the nearest resistances at $0.12, $0.13, and $0.14 before traders can consider additional levels for the trade.
On the contrary, a down surge below the lower boundary of the channel could move the market to $0.05, $0.04, and $0.03 supports. Meanwhile, the technical indicator shows that the Relative Strength Index (14) is moving in the same direction above the 40-level, showing a sideways movement.
DEFC/USD Medium-term Trend: Ranging (4H Chart)
On the 4-hour chart, the DeFi Coin is currently changing hands at $0.073 below the 9-day and 21-day moving averages. If the bulls can hijack the price and push it above the 21-day moving average, the next key resistance level could be at $0.075. Reaching this level could move the coin to $0.085 and above. However, the Relative Strength Index (14) crosses above the 40-level, suggesting a bullish movement.
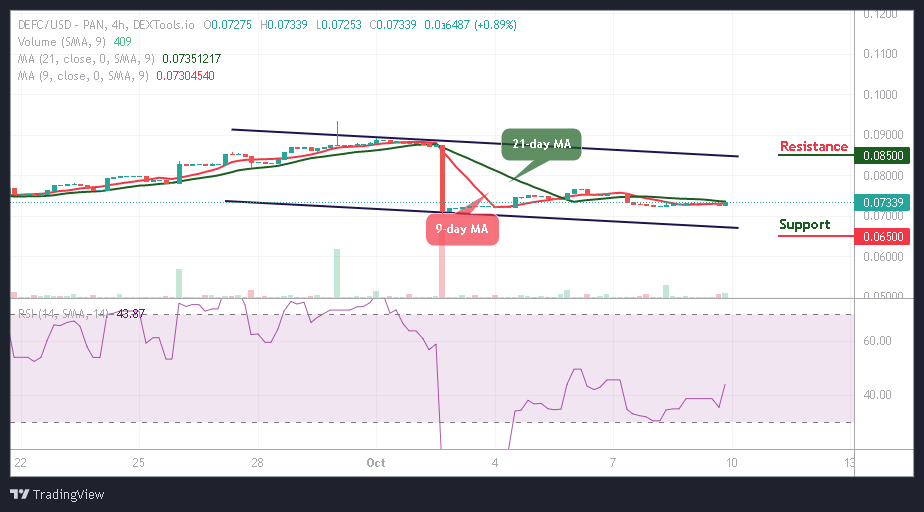
Meanwhile, if the bulls fail to get the price to cross above the 9-day and 21-day moving averages, the market may continue to move sideways. On the contrary, the DeFi Coin price is likely to see a sharp drop towards the lower boundary of the channel. Breaking below this barrier could bring the market to the support level of $0.065 and below.
You can purchase DeFi Coin here. Buy DEFC