Dogecoin (DOGE/USD) Market Is Steady Around $0.11 and $0.10
Estimated Reading Time: 3 minutes
Don’t invest unless you’re prepared to lose all the money you invest. This is a high-risk investment and you are unlikely to be protected if something goes wrong. Take 2 minutes to learn more
Dogecoin Price Prediction – December 6
The $0.12 resistance trading line has remained an overhead point as the DOGE/USD market remains steady around $0.11 and $0.10. Price is slightly keeping a positive-trading outlook at an average of 1.08%, as transactions are exchanging hands presently at $0.1026.
DOGE/USD Market
Key Levels:
Resistance levels: $0.12, $0.13, $0.14
Support levels: $0.080, $0.070, $0.060
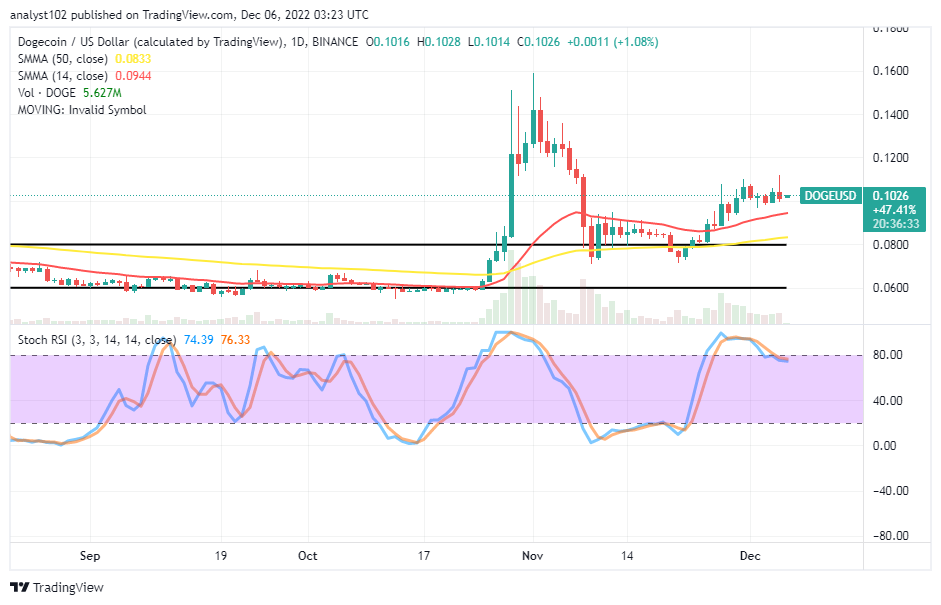
DOGE/USD – Daily Chart
The DOGE/USD daily chart showcases the crypto market is steady around $0.11 and $0.10 trading points over the buying signal side of the SMA trend lines. The 14-day SMA indicator is at $0.0944 above the $0.0833 value line of the 50-day SMA indicator. The horizontal line drawn at the $0.080, marking up the critical lower-trading spot price, will encounter when trying to intensify a declining motion afterward. The Stochastic Oscillators have positioned somewhat northbound from the overbought region to 76.33 and 74.39 levels.
Can positions in the DOGE/USD market operation be lost below the $0.12 resistance?
A kind of confluence sign is in place in the DOGE/USD market operations, suggesting that the crypto trade is steady around $0.11 and $0.10. Technically speaking, buyers won’t be able to push back up for profit-regaining motions until a line of swing lows forms near or around the support of the $0.08 lines. A breakout against the $0.12 resistance may not purposely put buying spree into sustainable high-trading zones.
On the negative side of the technical analysis, it may take more time before seeing the crypto market operation declining below or around the $0.12 resistance level. It will be when a volatile move occurs to define a definite direction price may follow away from its current light-converging spots characterized by $0.11 and $0.10 points. Sellers o be cautiously alert before launching a position, especially if no sign of active reversal force isn’t in enforcement.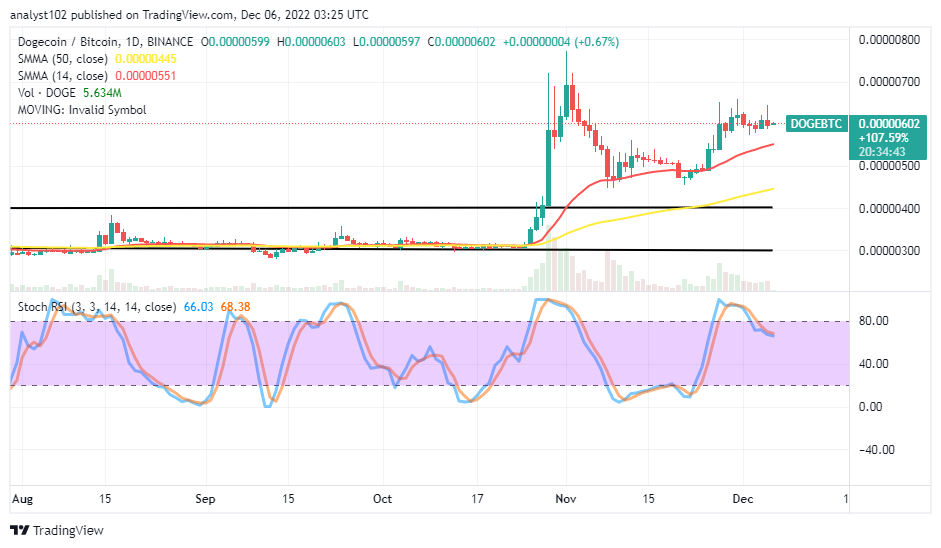
DOGE/BTC Price Analysis
In comparison, Dogecoin’s trending weight outweighs the pushes of Bitcoin as the pairing crypto trade is steady at a trading spot above the trend lines of the SMAs. The 14-day SMA indicator is over the 50-day SMA indicator. The Stochastic Oscillators have traveled southbound from the overbought region to place at 68.38 and 66.03 levels. According to the current trading outlook, it is possible to observe a devaluation process for a while, in a lighter-moving mode, before allowing a return to experiencing some upswings later.
Note: Cryptosignals.org is not a financial advisor. Do your research before investing your funds in any financial asset or presented product or event. We are not responsible for your investing results.
You can purchase Lucky Block here. Buy LBLOCK