Dogecoin (DOGE/USD) Market Moves More Slowly Toward $0.08
Estimated Reading Time: 3 minutes
Don’t invest unless you’re prepared to lose all the money you invest. This is a high-risk investment and you are unlikely to be protected if something goes wrong. Take 2 minutes to learn more
Dogecoin Price Prediction – January
The present trading posture in the DOGE/USD trade operations may result in a declining motion as it moves more slowly, rallying toward the $0.08 resistance point over a couple of sessions. There have been negative signs about variant figures showing the status the market is maintaining as of writing. Price is rated average on 0.55 percent negative.
DOGE/USD Market
Key Levels:
Resistance levels: $0.08, $0.085, $0.090
Support levels: $0.065, $0.060, $0.055
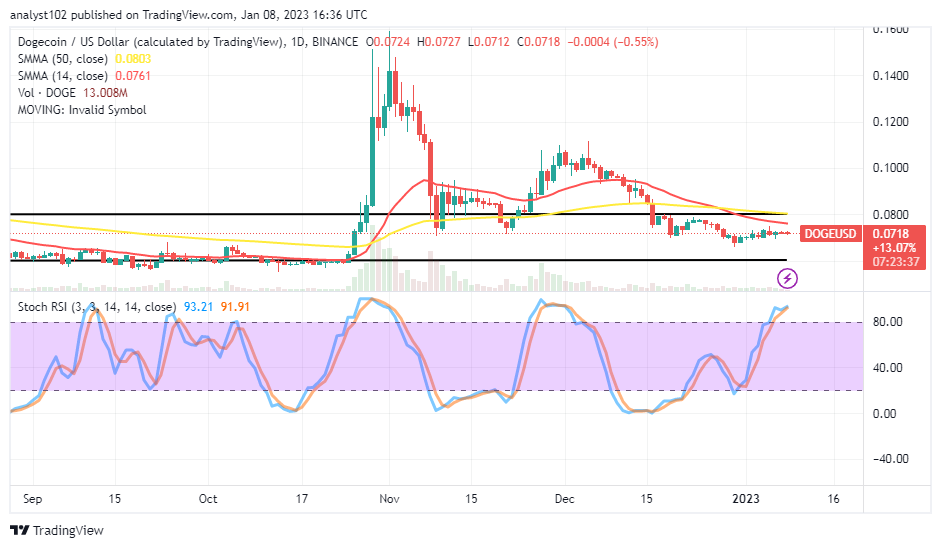
DOGE/USD – Daily Chart
The daily chart showcases that the DOGE/USD market moves more slowly as it rallies toward the $0.08 resistance level. According to that trading outlook, price movements would have to return to their baseline. The 14-day SMA indicator is at $0.0761, underneath the $0.0803 value line of the 50-day SMA indicator. The Stochastic Oscillators have moved into the overbought region to keep 91.91 and 93.21 levels slightly to the northbound.
What price movement will the DOGE/USD market operations favor in the following trading sessions?
Most trading indicators have given near-possible nullifying signs against the getting reliable upwards in the DOGE/USD market operations as it moves more slowly as it rallies toward the $0.08 resistance point. The bulls’ ability to move the cryptocurrency’s valuation into a growing mode will likely take more time to achieve, according to the Stochastic Oscillators, than it will if it stays in either a sideways or decreasing motion.
On the devaluation side of the technical analysis, sellers’ actions are in the offing to outweigh or counter any effort the DOGE/USD market bulls may intend to put up with from its present trading spot closely below the trend line of the 14-day SMA. The interception of the bigger SMA by the smaller SMA to the downside, placing over the current trade line, shows the price is liable to surrender to another round of retracement-moving process in no time.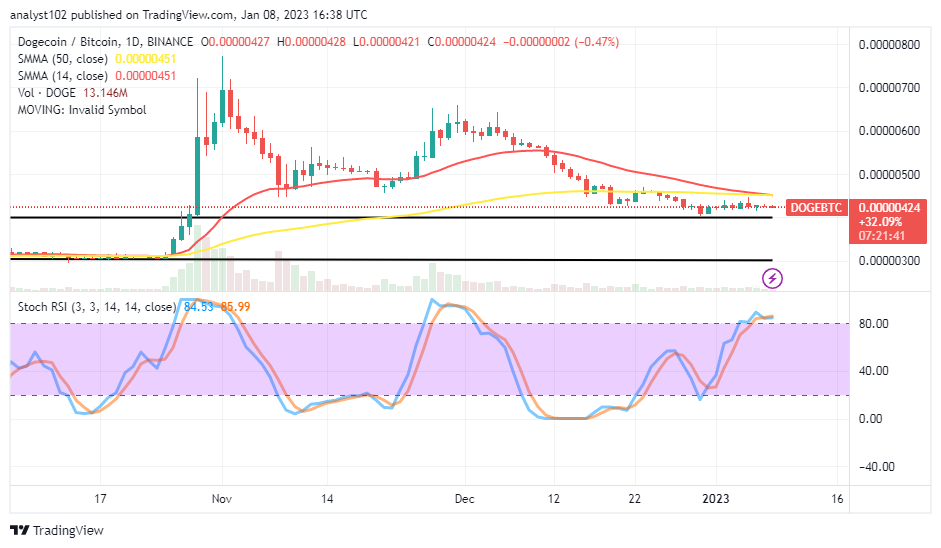
DOGE/BTC Price Analysis
Dogecoin, compared to Bitcoin, the trending capacity outlook of the former instrument moves more slowly below the trend lines of the SMAs. The 14-day SMA indicator has traveled southward to join the 50-day SMA indicator. The Stochastic Oscillators have penetrated the overbought region at 85.99 and 84.53 levels to showcase that the base crypto is gradually losing momentum to its counter-trading crypto. At this moment of analytics, traders will have to pay much attention to the reading outlook of the Stochastics before making a decision.
Note: Cryptosignals.org is not a financial advisor. Do your research before investing your funds in any financial asset or presented product or event. We are not responsible for your investing results.
You can purchase Lucky Block here. Buy LBLOCK