Dogecoin (DOGE/USD) Price Index Witnesses a Sharp Decline
Estimated Reading Time: 3 minutes
Don’t invest unless you’re prepared to lose all the money you invest. This is a high-risk investment and you are unlikely to be protected if something goes wrong. Take 2 minutes to learn more

Free Crypto Signals Channel
Dogecoin Price Prediction – October 10
Trading activities in the DOGE/USD market that produced a series of lower highs have touched a hard high-trading point, making the crypto’s price index witness a sharp decline about three days ago. The crypto trade value is at $0.0608.
DOGE/USD Market
Key Levels:
Resistance levels: $0.063, $0.065, $0.67
Support levels: $0.060, $0.058, $0.056
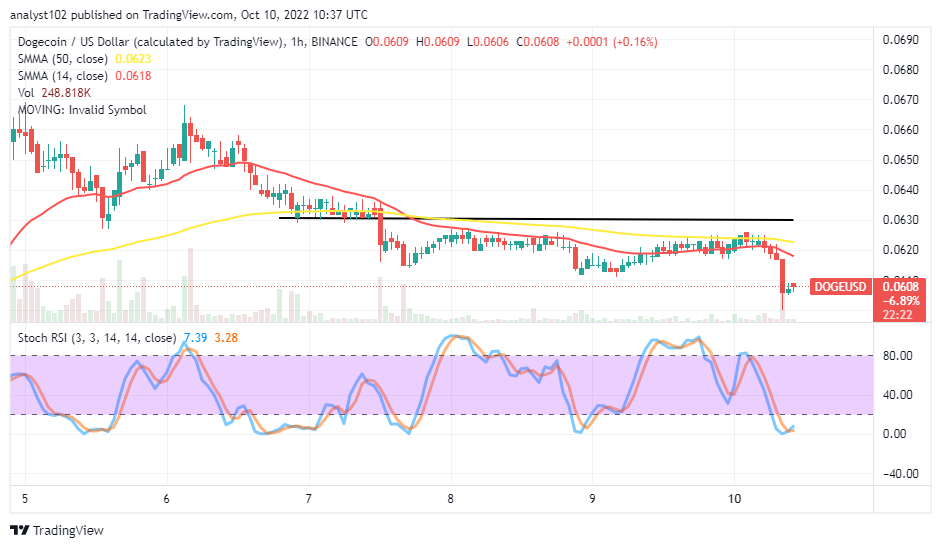
DOGE/USD – Daily Chart
The DOGE/USD daily chart portrays the crypto-market index price witnesses a sharp decline underneath the trend lines of the SMAs. The 14-day SMA indicator is at $0.0618, beneath the 50-day SMA indicator, which is around the $0.0623 value line. The horizontal line drew over the SMA trend lines at $0.0630, showing where the real resistance zone over several sessions. The Stochastic Oscillators have dipped down the oversold region, trying to cross back northbound at 3.28 and 7.39 range points.
Will the DOGE/USD market soon find a baseline to make an upward swing?
Expectantly, the DOGE/USD market is likely to get support between the lines of $0.060 and $0.055 as the trade price index witnessed a sharp decline. The major-falling situation in the last three days touched firm support at $0.060 to produce a bottom shadow candlestick that led to a smaller bullish candlestick on the following day. Those conditions suggest the market bulls are gradually making a comeback.
On the downside of the DOGE/USD market technical analysis, it would be technically okay for the market to rally back upward to the trend line of the smaller SMA before succumbing to another cycle of decrease-moving mode afterward. Even though a smaller bearish tends to emerge before the end of today’s session, it might not be a good idea to exert a selling order around the $0.0610 level.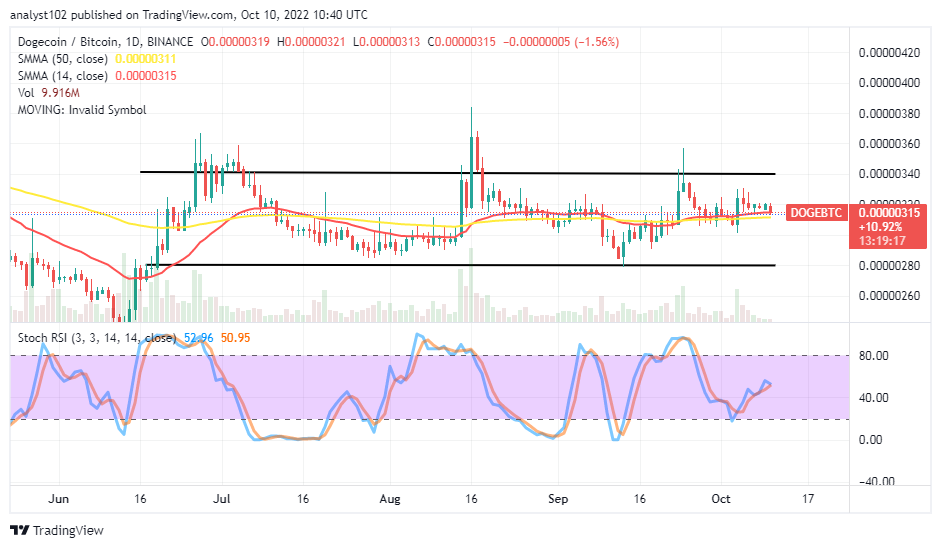
DOGE/BTC Price Analysis
In contrast to Bitcoin’s tendency to trend upward in range-bound zones, Dogecoin continues to advance. As against the situation in the market operations involving the former instrument and the later trading tool, the price index is yet to experience a sharp decline. The 14-day SMA indicator is closely over the 50-day SMA indicator. The Stochastic Oscillators have crossed northbound from the range of 40 to 50.95 and 52.96 range lines. They appear, losing their stance gradually to the downside.
Note: Cryptosignals.org is not a financial advisor. Do your research before investing your funds in any financial asset or presented product or event. We are not responsible for your investing results.
You can purchase Lucky Block here. Buy LBLOCK