Dogecoin (DOGE/USD) Price Runs a Risk of Collapsing Through $0.070
Estimated Reading Time: 3 minutes
Don’t invest unless you’re prepared to lose all the money you invest. This is a high-risk investment and you are unlikely to be protected if something goes wrong. Take 2 minutes to learn more
Dogecoin Price Prediction – May 22
A bearish-trading path has been set up in the DOGE/USD market as the price is open to a risk of collapsing through the $0.070 support trading zone. Between the contested point and the $0.080 resistance line, the most challenging resistance axis has been. The negative rating for a less-active drop is 0.69 percent. The summary financial forecast report has it that so much energy to rejuvenate the crypto’s valuation has been exhausted, putting the price to potentially experience other rounds of fall-offs session if bulls tend not to oppose the intensity of selling operations under the current downward settings.
DOGE/USD Market
Key Levels:
Resistance levels: $0.080, $0.085, $0.090
Support levels: $0.065, $0.060, $0.055
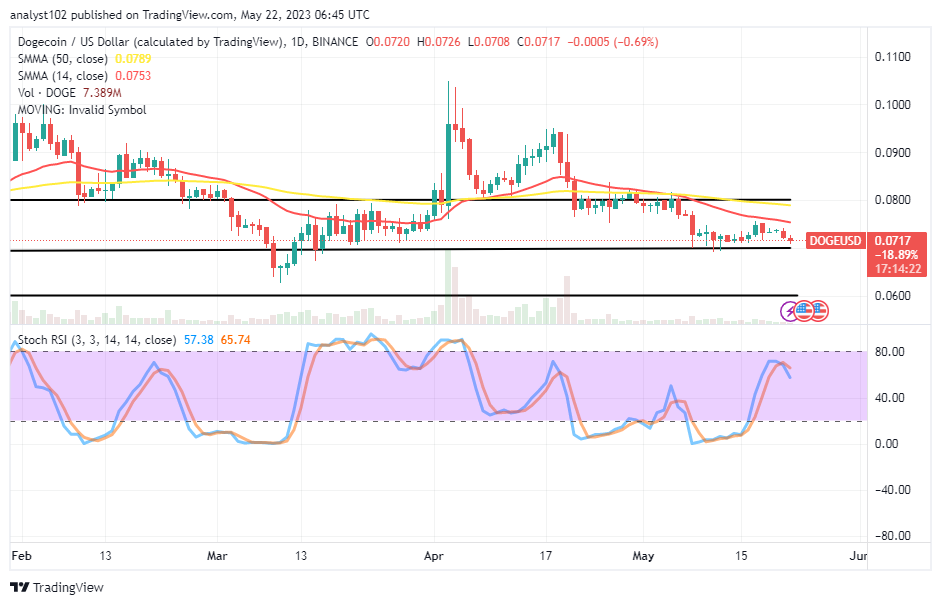
DOGE/USD – Daily Chart
The DOGE/USD daily chart shows the crypto-economic price runs a risk of collapsing through the $0.070 underneath the southward-trending positioning of the SMAs’ trend lines. The 14-day SMA indicator is at $0.0753, below the $0.0789 point of the 50-day SMA indicator. The Stochastic Oscillators have succumbed to a southbound-crossing at 65.74 and 57.38 levels. It demonstrates that some fall lengths will still manifest in the subsequent operations.
Will the US dollar eventually lose its purchasing power in the face of the Dogecoin market?
The Dogecoin market operations have been in the habit of losing stances alongside or closely below the trending path of the 14-day SMA over time as the crypto-economic price tempts running a risk of collapsing through the $0.070 psychological trading zone. It would be an ideal technical trading moment for long-position takers to await the reading of the Stochastic Oscillators in a lower-trading spot to signal the possibility of bears having a lower capacity sign to the downside before placing back buy positions.
On the downward-trending side of the DOGE/USD technical analysis, sellers may have to rely on getting reliable pushes between the trend lines of the 14-day and 50-day SMAs. Launching an immediate short order lacks the necessary powerful momentum currently to prevent returning to those high indicator lines in the future. As a result, bears must be cautious when conducting business.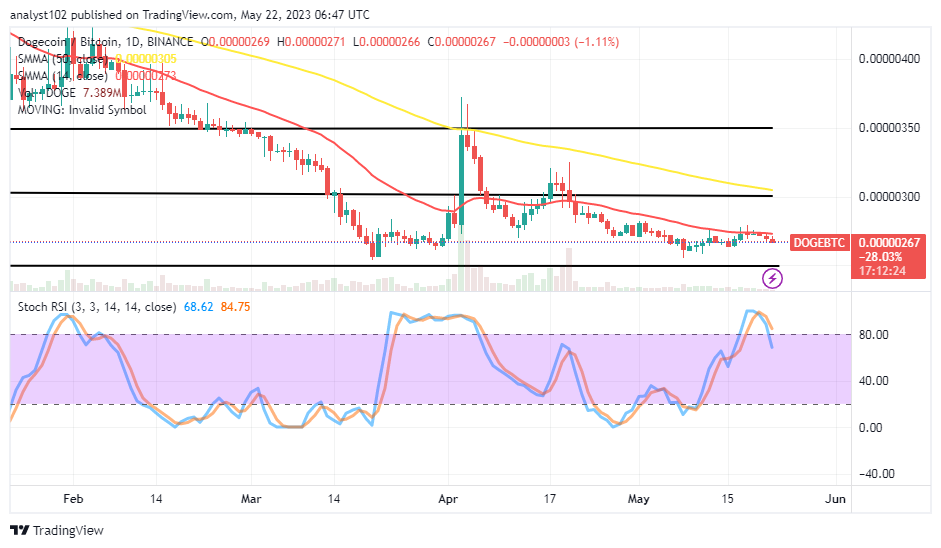
DOGE/BTC Price Analysis
In comparison, the Dogecocoin market is risking, collapsing through some supports back to the previous lower-trading arena. The 50-day SMA trend line is above the 14-day SMA trend line, affirming that a chain of drops is in the pipeline. The Stochastic Oscillators have crossed southbound from the overbought region to 84.75 and 68.62 levels. That signifies the need to be patient against longing positions.
Note: Cryptosignals.org is not a financial advisor. Do your research before investing your funds in any financial asset or presented product or event. We are not responsible for your investing results.
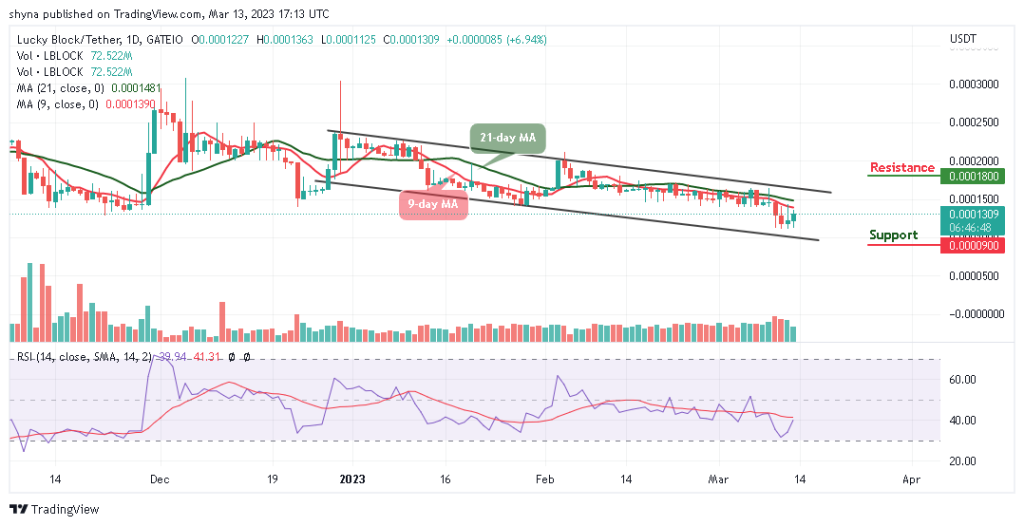
You can purchase Lucky Block here. Buy LBLOCK