Dogecoin (DOGE/USD) Price Trades Close to $0.12
Estimated Reading Time: 3 minutes
Don’t invest unless you’re prepared to lose all the money you invest. This is a high-risk investment and you are unlikely to be protected if something goes wrong. Take 2 minutes to learn more
Dogecoin Price Prediction – November 29
Transactions in the DOGE/USD market operations have led the crypto’s price to trade close to a high point at the $0.12 line. Based on that condition, the bullish outlook has maintained between $0.1026 and $0.0936 at an average percentage rate of 7.16.
DOGE/USD Market
Key Levels:
Resistance levels: $0.12, $0.13, $0.14
Support levels: $0.08, $0.070, $0.060
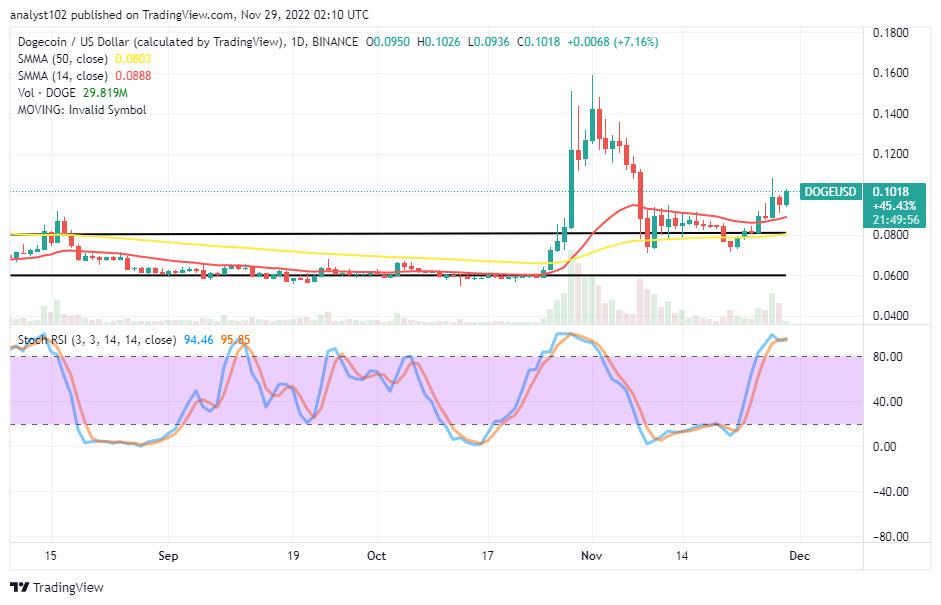
DOGE/USD – Daily Chart
The DOGE/USD daily chart reveals that the crypto’s price trades close to the $0.12 resistance level above the SMA trend lines. The 14-day SMA indicator is at the $0.0888 value line above the $0.0803 point of the 50-day SMA indicator. The Stochastic Oscillators are in the overbought region, keeping 95.85 and 94.46 levels. That shows that the upward-moving motions are gradually reducing in gravity. An occurrence of a bearish candlestick may produce a resumption of a declining trend.
Will it be technically inclined to follow some ups from the DOGE/USD market current trading pace afterward?
It might not save for long-position placers to execute a buying order at the current trading capacity in the DOGE/USD trade operations as the crypto’s price trades close to the $0.12 resistance level. The following buying force may only bring about a situation for completing the journey around the resistance value point earlier mentioned.
On the negative side of the technical analysis, bears need to stage up barriers between the $0.11 and around the $0.12 resistance line. Short-position players to be on the lookout to spot active price rejections that can lead to a correction before placing a shorting order. A full-fledged formation of a bearish candlestick at any moment from now will leave a tail end at a high-trading spot to the subsequent upward pushes.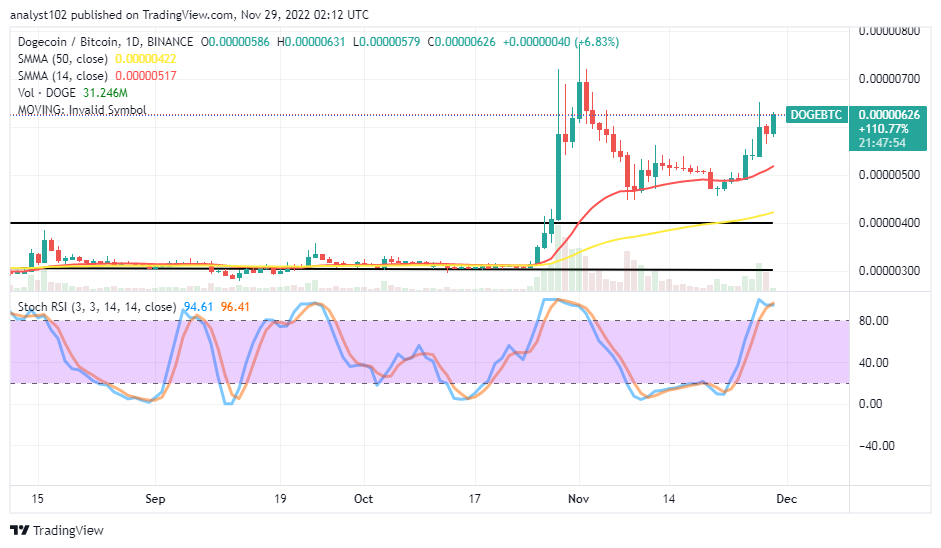
DOGE/BTC Price Analysis
In comparison, Dogecoin still holds firmer in its pushes against the trending force of Bitcoin at a far distance over the buying signal side of the SMAs. The 14-day SMA indicator is above the 50-day SMA indicator. The Stochastic Oscillators are in the overbought region, keeping 96.41 and 94.61 levels to indicate the base crypto is on the verge of running downward against its counter-trading crypto, especially if it fails to break further through resistances around the B0.00000700 in the long run.
Note: Cryptosignals.org is not a financial advisor. Do your research before investing your funds in any financial asset or presented product or event. We are not responsible for your investing results.
You can purchase Lucky Block here. Buy LBLOCK