Ethereum (ETH) Resumes an Upward Move, Battles the Resistance At $2,150
Estimated Reading Time: 2 minutes
Don’t invest unless you’re prepared to lose all the money you invest. This is a high-risk investment and you are unlikely to be protected if something goes wrong. Take 2 minutes to learn more

Ethereum Price Long-Term Analysis: Bullish
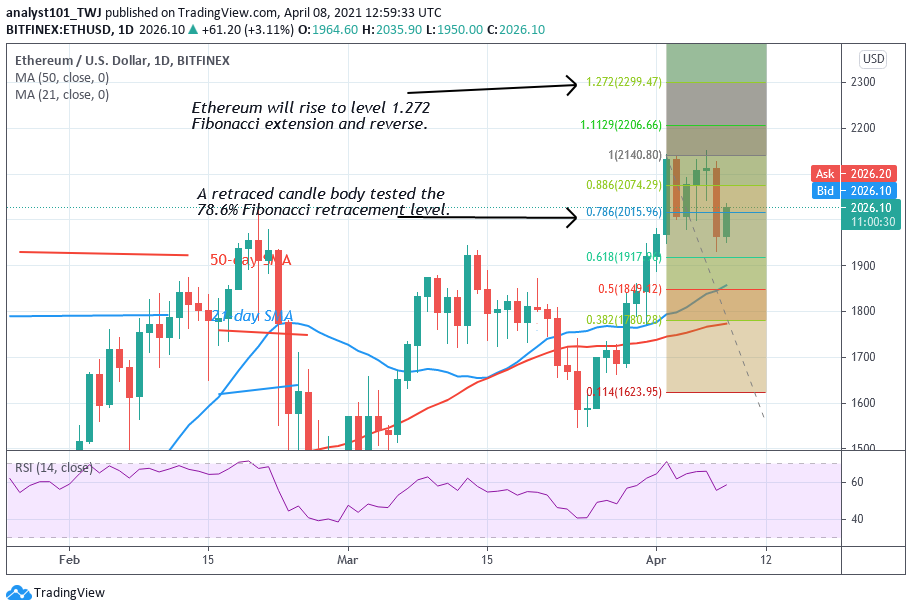
Yesterday, Ethereum fell to $1,960 low and resumed uptrend immediately. Ether is now fluctuating above the $2000 support but the uptrend has been stalled below the $2,150 high. The uptrend will resume once the bulls break the $2,150 resistance. The market is expected to rise to level $2,500 price level. Meanwhile, on April 2, a retraced candle body tested the 78.6% Fibonacci retracement level. It indicates that the market will rise to level 1.272 Fibonacci extensions or the high of $2,299.47.
Ethereum Indicator Analysis
Ether is at level 58 of the Relative Strength Index period 14. It indicates that the coin is in the uptrend zone and above the centerline 50. The 21-day and 50-day SMA are sloping on the upside indicating the uptrend. The biggest altcoin is above the 40% range of the daily stochastic. The coin has resumed bullish momentum as it is above the 30% range of the daily stochastic.
Technical indicators:
Major Resistance Levels – $2, 500, $2,700, $2,900
Major Support Levels – $1.500, $1, 300, $1,100
What Is the Next Direction for Ethereum?
On 4- hour Chart, Ethereum has continued its sideways move as the crypto faces rejection at the $2,150 high. The altcoin has fallen to $1,960 low and resumed above $2,000 support. On April 2 uptrend; a retraced candle body tested the 78.6% Fibonacci retracement level. This retracement implies that Ether will rise to level 1.272 Fibonacci extensions or the high of $2,239.08. The market will reverse at this level.
Note: cryptosignals.org is not a financial advisor. Do your research before investing your funds in any financial asset or presented product or event. We are not responsible for your investing results