Ethereum (ETH/USD) Approaches Lower Range
Estimated Reading Time: 3 minutes
Don’t invest unless you’re prepared to lose all the money you invest. This is a high-risk investment and you are unlikely to be protected if something goes wrong. Take 2 minutes to learn more
Ethereum Price Prediction – July 12
The ETH/USD market approaches a lower range trading level of $2,000 to trade around $2,148. The crypto’s percentage rate records a 0.37 as of writing.
ETH/USD Market
Key Levels:
Resistance levels: $2,500, $3,000, $3,500
Support levels: $2,000, $1,800, $1,600
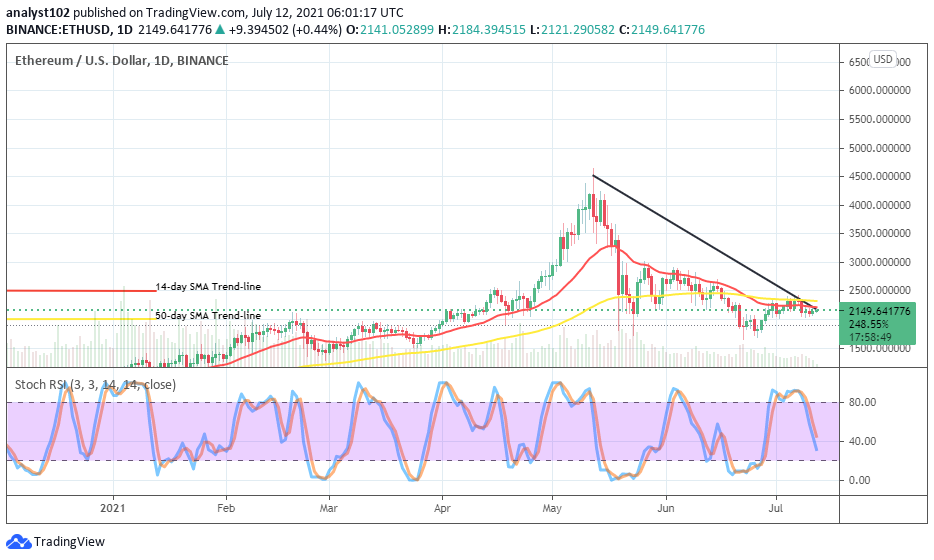
ETH/USD – Daily Chart
There has been a short line of variant smaller candlesticks on the ETH/USD daily chart, denoting that the crypto’s price approaches the lower range zone at $2,000. The 50-day SMA trend-line is over the 14-day SMA trend-line in the range-bound zones of $2,500 and the value earlier mentioned. The bearish trend-line remains drawn downward across them to place a markdown sign on the smaller SMA. The Stochastic Oscillators are pointing southbound slightly past range 40 to portend that the pressure to the downside is still to some extent ongoing in the crypto operations.
Is there an indication to back a further downward move in ETH/USD as price approaches the lower range?
There is, yet, no strong-backing signal that the ETH/USD market may go down sustainably below the lower range as price approaches currently. To get a decent longing position; a pull-down against the lower range line is necessary to allow happening before considering joining the move while a reversal in that regard is spotted.
On the downside, bears to put pressure on the present point of the trading position below the mid-point of those values that observed as range-bound zones. A lowly and gradual push against the lower range mark could, in the long run, degenerated into a smaller-successive bearish trend. In the event of that assumption playing out, the market would then term to be reaching out for its bearish move exhaustion.
ETH/BTC Price Analysis
Comparing the market pushing capability that currently exists between Ethereum and Bitcoin, the base crypto appears to still have the upper hand pairing with the flagship counter crypto. The extent to which BTC pushes against ETH has only been in a correctional-moving manner as indicators raise high around the formation pattern of the variant candlesticks depicting the actual level of the market’s actions so far. The 14-day SMA remains over the 50-day SMA as the bullish trend-line drew northward between them t place a supportive mark below the current candlestick in the making. The Stochastic Oscillators have slightly moved southbound near range 20. They may soon be trying to close the lines in preparation to determine other actions.
Note: new.cryptosignals.org is not a financial advisor. Do your research before investing your funds in any financial asset or presented product or event. We are not responsible for your investing results.
You can purchase crypto coins here. Buy Tokens