Ethereum (Eth/Usd) Embarks on a Slight Rallying Move
Estimated Reading Time: 3 minutes
Don’t invest unless you’re prepared to lose all the money you invest. This is a high-risk investment and you are unlikely to be protected if something goes wrong. Take 2 minutes to learn more
Ethereum Price Prediction – May 24
The ETH/USD price has seemingly embarked on a rallying movement from the depth of a lower trading zone. The crypto market now sees an increase of 15.54% at the market value of around $2,425.
ETH/USD Market
Key Levels:
Resistance levels: $3,000, $3,500, $4,000
Support levels: $2,000, $1,700, $1,400
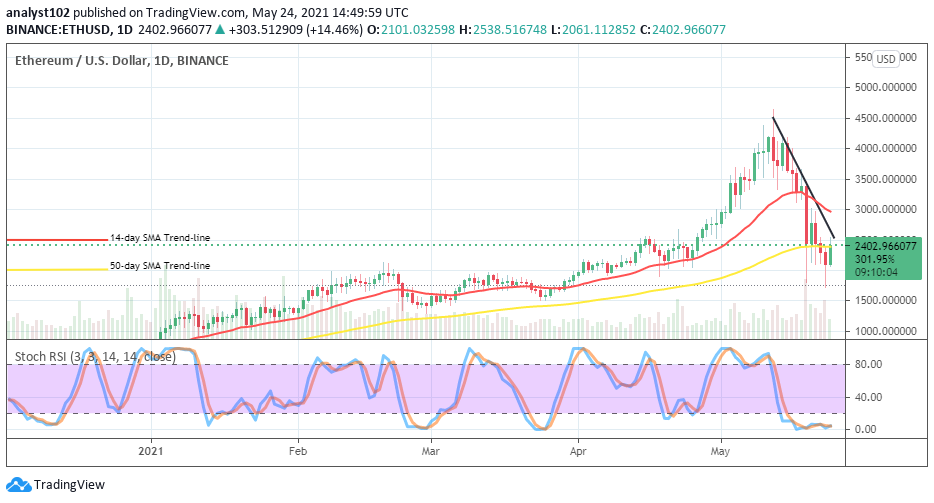
ETH/USD – Daily Char
It is showcased on the ETH/USD chart that after a couple of days of downward forces, a promising bullish candlestick is now in the forming to signify a return of upswing. Today’s session seems to potentially mark the beginning of an upswing after finding support around the level of $2,000. The bearish trend-line has drawn across the smaller SMA to the south. The 14-day SMA trend-line has slightly curved southwardly at a far point above the 50-day SMA. And, also the bigger SMA is curved somewhat in the same manner at the point it is situated. The Stochastic Oscillators are in the oversold region moving in a consolidation manner to still indicate the presence of bears in the crypto market.
Will there the ETH/USD set on a quick recovery move?
Some degrees of effort is being put up by the ETH/USD bulls to stage a recovery against the recent downward moves. Despite the falling forces, the keeping of a distance between the two SMAs indicates that the crypto’s quick recovery moving mood is at this time dicey. However, different buy position entries are liable to resurface while price pushes with less impulse to the south towards the point of $2,000.
As regards the downside, bears have to build up resistance in between the levels of $2,500 and $3,000 in retardation to any further upswing price may be eventually around that trading areas. Having said that, the major critical market level that price may get dropped couldn’t be more than $1,500 support level afterward. A pause of the current upswing around the first lower value earlier mentioned will lead the market to go down.
ETH/BTC Price Analysis
The kind of downward price movements in the ETH/BCT pair is somewhat to a larger extent being viewed as correctional trading time. In the light of that, the price has only dropped from far above the level of the smaller SMA to now move around it. The bullish trend-line is a bit located underneath the 14-day SMA as the 50-day SMA is located below them all. The Stochastic Oscillators have conjoined the hairs in an attempt to seemingly re-open it to the north from the oversold region. That suggests the possibility of Ethereum setting to see a return of upside as placed with Bitcoin on a comparative weighing scale.
Note: new.cryptosignals.org is not a financial advisor. Do your research before investing your funds in any financial asset or presented product or event. We are not responsible for your investing results.