Ethereum (ETH/USD) Gradually Embarks on a Northbound Move Trading past the $2,400 Level
Estimated Reading Time: 3 minutes
Don’t invest unless you’re prepared to lose all the money you invest. This is a high-risk investment and you are unlikely to be protected if something goes wrong. Take 2 minutes to learn more
Ethereum Price Prediction – April 26
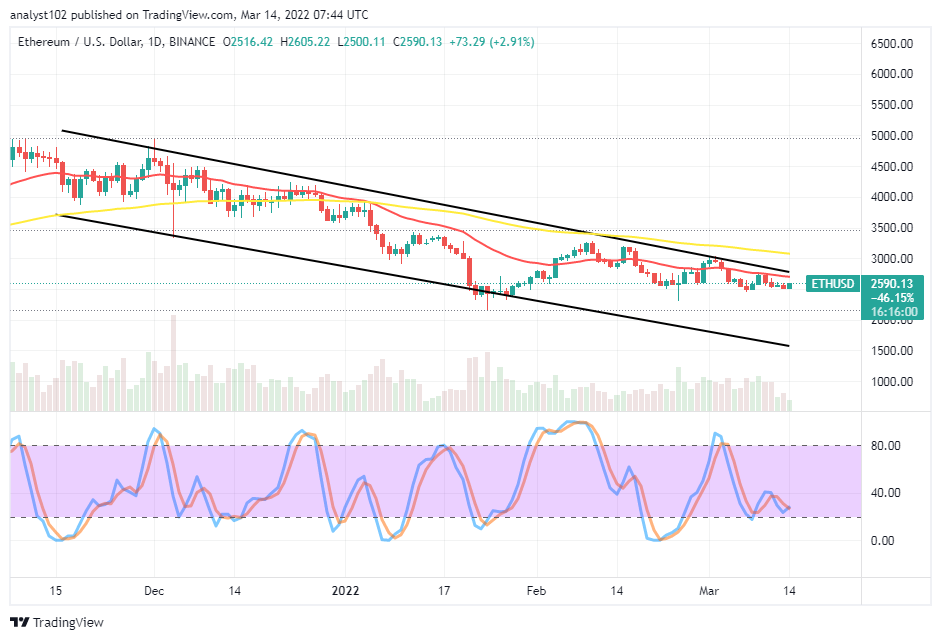
It is shown now that the ETH/USD market has started increasing after its recorded a slight reversal move down to around $2,000 level.
ETH/USD Market
Key Levels:
Resistance levels: $2,600, $2,800, $3,000
Support levels: $2,100, $1,900, $1,700
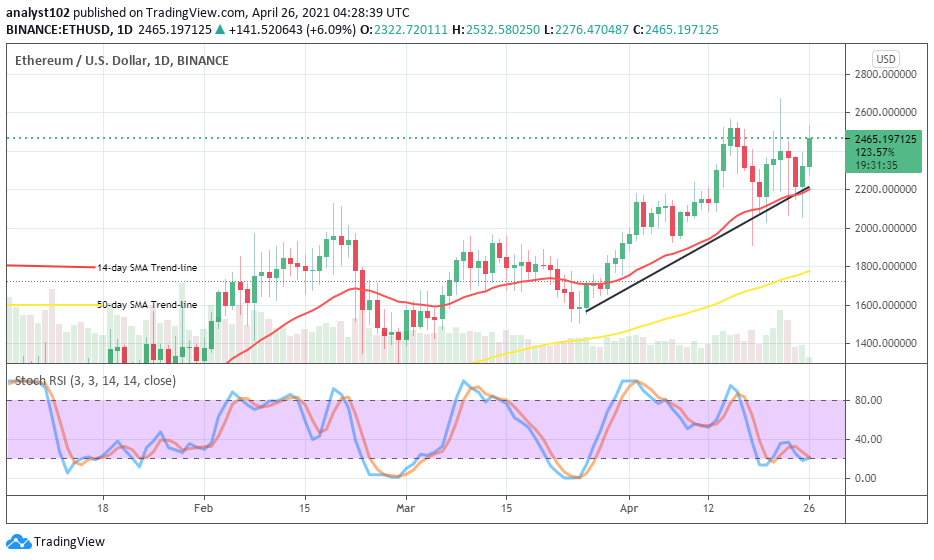
ETH/USD – Daily Chart
There have now been emergences of two bullish candlesticks from the point of buy signal of both the 14-day SMA trading indicator and the bullish trend-line drawn on the ETH/USD daily chart. That gives a promising sign that the crypto-market will be on a strong moving spree upward back to achieve the previously averaged high value of $2,600. The 50-day SMA indicator is located tightly below the support of $1,800 far below the trend-line of 14-day SMA. The Stochastic Oscillators are consolidating around ranges 40 and 20. And, they have closed the hairs at range 20 in an attempt to cross to the north to possibly suggest a return of an upswing.
Will the ETH/USD trades past the $2,600 resistance in a near session?
Having this time around survived from a recent slight downward move, the ETH/USD market worth has now set on a higher impressive upswing moving mode from the low levels of $2,000 to trade around $2,500. However, the $2,200 point is still in focus as indicated as the key support level for the present upward move in the market. Therefore, bulls need to be wary of that trading line.
It appears that bears in this crypto-market have not had it easier to sustainably push against most of the rebounding moves been featuring over time. That statement calls for cautiousness on the part of traders wishing to come into this market. However, some sell-signals are bound to resurface at high resistance trading points while price of an uptrend move is exhausted either in the long or medium-term run.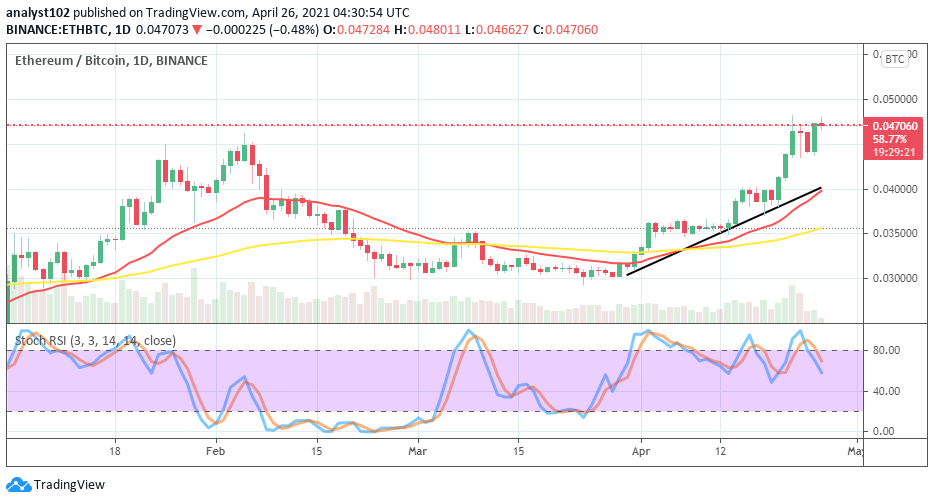
ETH/BTC Price Analysis
In the habit of comparing the power of purchasing currently existing between ETH and BTC, the trading chart has revealed that the base crypto is even now on a higher appreciating mode against the counter trading instrument than in the last form. The 14-day SMA trend-line is located over the 50-day SMA indicator as they are placed underneath the level of purchasing power of ETH as paired with BTC. The Stochastic Oscillators are seen seemingly moving in a consolidation around range 80 placing in between the overbought region and range 40. That suggests that the base crypto is gathering much-required energy to continue to prevail over its countering trading instrument.
Note: cryptosignals.org is not a financial advisor. Do your research before investing your funds in any financial asset or presented product or event. We are not responsible for your investing results.