Ethereum (ETH/USD) Intensifies Pressure at $2,000
Estimated Reading Time: 3 minutes
Don’t invest unless you’re prepared to lose all the money you invest. This is a high-risk investment and you are unlikely to be protected if something goes wrong. Take 2 minutes to learn more
Ethereum Price Prediction – June 21
There has been a line of active moves in the market operation of ETH/USD as price intensifies pressure around the lower range point of $2,000. As of writing, the crypto’s value trades with the US Dollar at the point of $2,034 at a rate of about -9.32 percent.
ETH/USD Market
Key Levels:
Resistance levels: $2,500, $3,000, $3,500
Support levels: $1,800, $1,600, $1,400
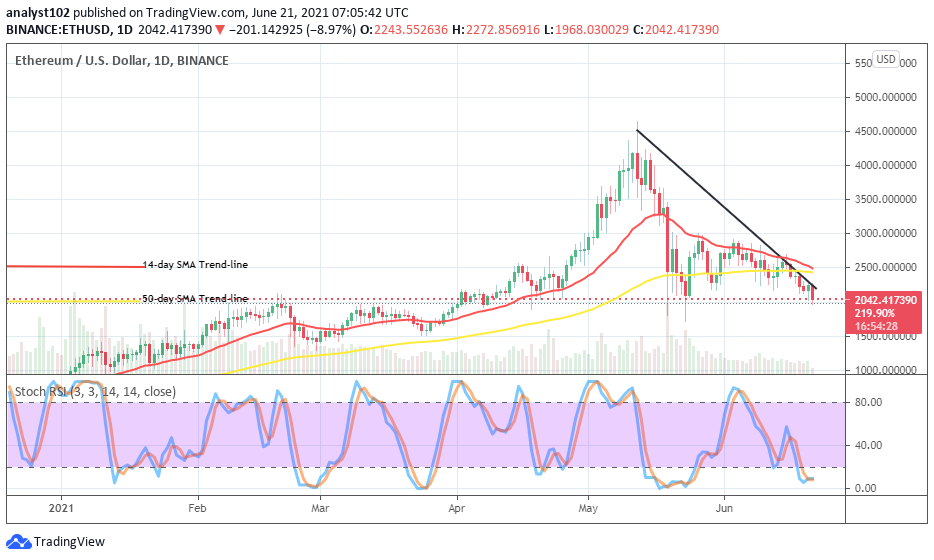
ETH/USD – Daily Char
The ETH/USD daily chart today showcases how price intensifies pressure at the lower range trading spot of $2,000. A bearish candlestick has emerged breaching the point to a lower support level underneath the trading indicators. The 14-day SMA trend-line remains bent downward closely above the 50-day SMA indicator as the bearish trend-line drew across them southward to place a mark at the starting point of the current downward move in the market. The Stochastic oscillators are dipped into the oversold region with closed lines in an attempt to move in a consolidation manner. That portends that within a matter of time; there will be a swing up.
Could there be a valid support for the ETH/USD bulls around the level of $2,000?
The level of $2,000 now appears to be a good line of support around which some degree of variant up-swinging is liable to be made during today’s downward moves. In this crypto market, it’s needed to be recalled that three valid range levels are involved. And, they are $3,000, $2,500, and $2,000. Therefore, the last of them happens to be the critical support trading zone of the crypto economy. Some buy entries are expected to feature around it.
On the downside, bears needed to hold their positions around the current lower range line to breach southward further. But, they should be wary of quick reversal moves that could feature along with intense downward pressure as it features. A successful reversal of a downward motion to break out the market level of around $2,200 could potentially put an end to getting a good entry for a sell order
ETH/BTC Price Analysis
The trending weight of Ethereum versus Bitcoin remains seeing being in a correctional mode on the price analysis chart. But, currently, the trading situation showcases that there is a line of sideway moving outlook of the cryptos in between the SMAs. The 50-day SMA indicator and the bullish trend-line are closely drawn below the trading point as the 14-day SMA trend-line is located over them. The Stochastic Oscillators are dipped into the oversold region moving in a consolidation manner to exhibit that the two trading coins are currently somewhat in an indecision trending position.
Note: new.cryptosignals.org is not a financial advisor. Do your research before investing your funds in any financial asset or presented product or event. We are not responsible for your investing results.
You can purchase crypto coins here. Buy Tokens