Ethereum (ETH/USD) Market Builds a Baseline at $1,750
Estimated Reading Time: 3 minutes
Don’t invest unless you’re prepared to lose all the money you invest. This is a high-risk investment and you are unlikely to be protected if something goes wrong. Take 2 minutes to learn more

Free Crypto Signals Channel
Ethereum Price Prediction – June 6
There have been variant downs in the ETH/USD market operations for about three different trading occasions, allowing the crypto-economic market builds a baseline at $1,750. The US Dollar’s force has led the trade to feature around a $1,887 value line at 4.69% positives.
ETH/USD Market
Key Levels:
Resistance levels: $2,000, $2,250, $2,500
Support levels: $1,750, $1,500, $1,250
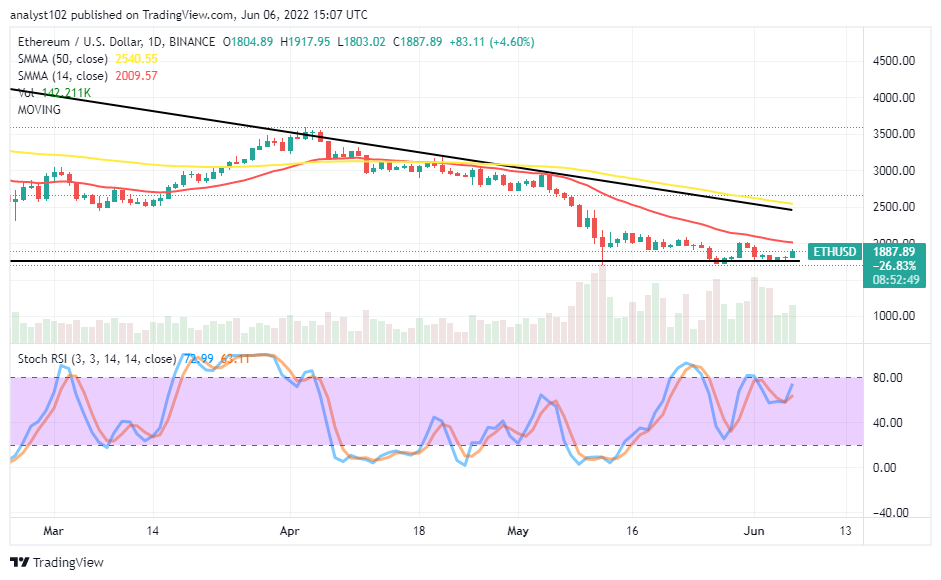
ETH/USD – Daily Chart
The ETH/USD daily chart reveals the crypto-economic market builds a baseline at $1,750 as there have been occasions that witnessed failing attempts to push downward past the value line in the past and the recent. The horizontal line is drawn at the point to allow the market to regard it as a pivotal trading line. The 14-day SMA trend line stretches southward above the current trading zone underneath the 50-day SMA trend line. The Stochastic Oscillators are trying to cross back northbound closely below the range of 80.
Will there soon be pushes past the $2,000 resistance level?
As soon as a bullish candlestick emerges against the 14-day SMA trend line around the $2,000 resistance level, the price may opt for pushes passing through some resistances above it. Long-position takers should be wary of overburdening positions. Therefore, small lot sizes are okay in position order at a given time. There still be a repeat of seeing price coming down to rebuild support around the baseline.
On the downside of the technical analysis, it is still somewhat that a tough-trading zone is awaiting any attempt by bulls to push past the $2,000 resistance level as indicated by the positioning of the 14-day SMA around it. Higher-resistant trading to the value line at the $2,250 level may reach for touch during a volatile motion from around the current lower-trading zone afterward.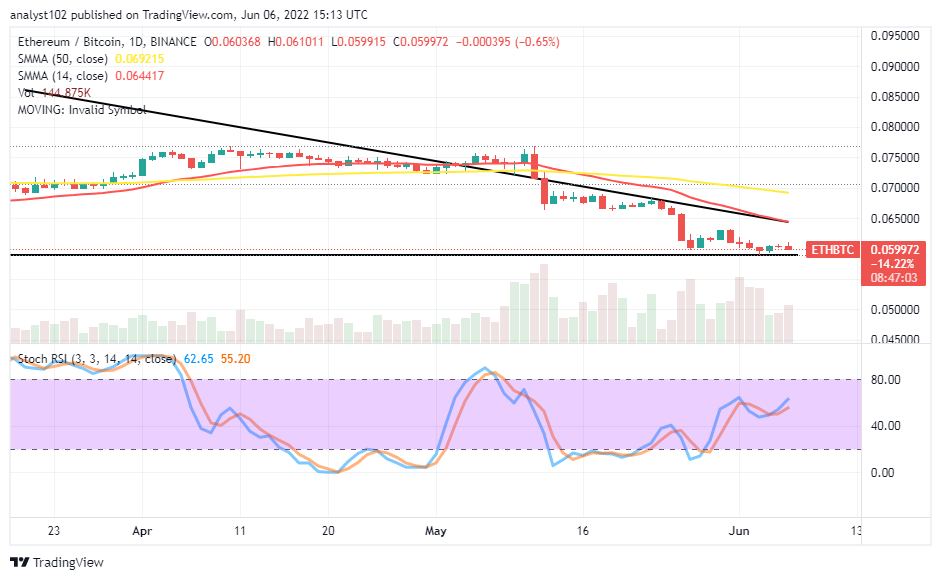
ETH/BTC Price Analysis
The Trending force of Bitcoin has continued to overpower that of Ethereum in its base positioning. The cryptocurrency pair market builds a baseline closely beneath its current trading spot underneath the SMA trend lines. The bearish trend line drew southward to join the 14-day SMA indicator below the 50-day SMA indicator. The stochastic Oscillators are in the middle of the 80 and 40 range points. If the ETH, as the base crypto, tends to weaken pairing with Bitcoin, the counter crypto, at this level, its baseline may expose to a sudden breakdown.
Note: Cryptosignals.org is not a financial advisor. Do your research before investing your funds in any financial asset or presented product or event. We are not responsible for your investing results.
“Lucky is up more than 50% today but still more than 430% from All Time Highs!
The opportunity to bank BIG is now!
You can purchase Lucky Block here. Buy LBlock