Ethereum (ETH/USD) Market Builds Energy from $1,000
Estimated Reading Time: 3 minutes
Don’t invest unless you’re prepared to lose all the money you invest. This is a high-risk investment and you are unlikely to be protected if something goes wrong. Take 2 minutes to learn more

Free Crypto Signals Channel
Ethereum Price Prediction – June 20
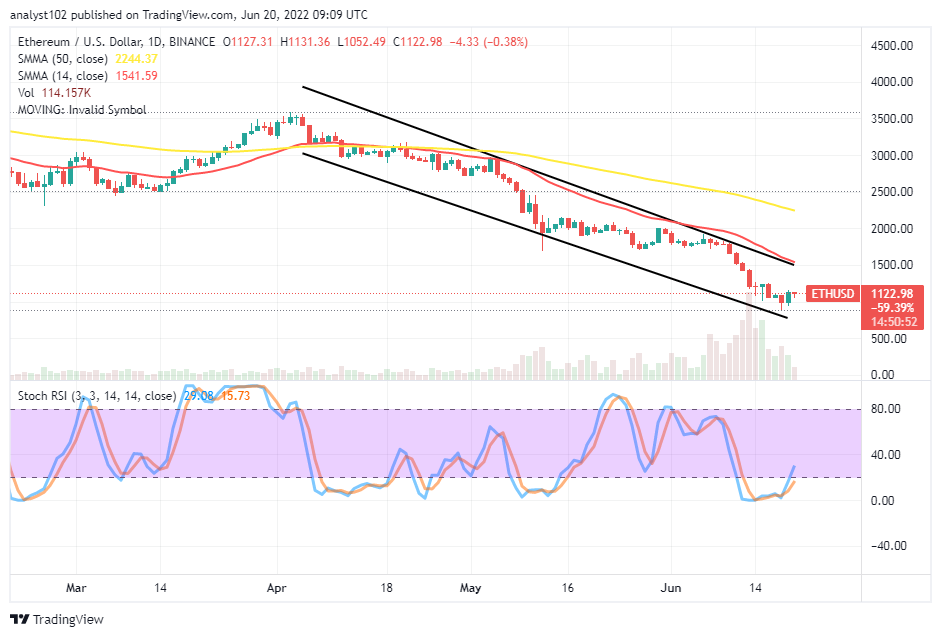
It is that the ETH/USD market builds energy from the $1,000 support level after making a brief breach past it to the downside during the last bearish-aggressively-trading sessions. As of the time of writing, the price now trades between $1,131 and $1,052 value lines, keeping a minimal negative percentage of 0.38.
ETH/USD Market
Key Levels:
Resistance levels: $1,500, $1,750, $2,000
Support levels: $1,000, $750, $500
ETH/USD – Daily Chart
The ETH/USD daily chart reveals the crypto market builds energy from a $1,000 psychological support level close to the lower bearish trend line. The upper bearish channel trend line drew southward as the smaller SMA trend line stretched around it to the south side. The 50-day SMA indicator is above the 14-day SMA indicator. The Stochastic Oscillators are in the oversold region, trying to swing northbound against the range of 20 from the within.
Will there be more features of ups in the ETH/USD market?
Yesterday’s trading session eventually produced a bullish candlestick. And it has been observed that the crypto market builds energy from around the $1,000 support level. A fearful price downward reversion against the value line can cause a loss of momentum, surpassing the previous lows. In the first stage of rallying chances, the price has up to around the $1,500 resistance level to satisfy the fact that it has doubled the rejection rate afterward.
On the downside of the technical analysis, the ETH/USD market bears appear, going into a relaxed trading condition, having been able to push downward aggressively in domineering the market-trading space over several sessions at the expense of the crypto’s buying weaknesses. An attempt by the Stochastic Oscillators to cross back southbound against the range of 20 will signal the possibility of bulls losing more than the past lower value points in the long run.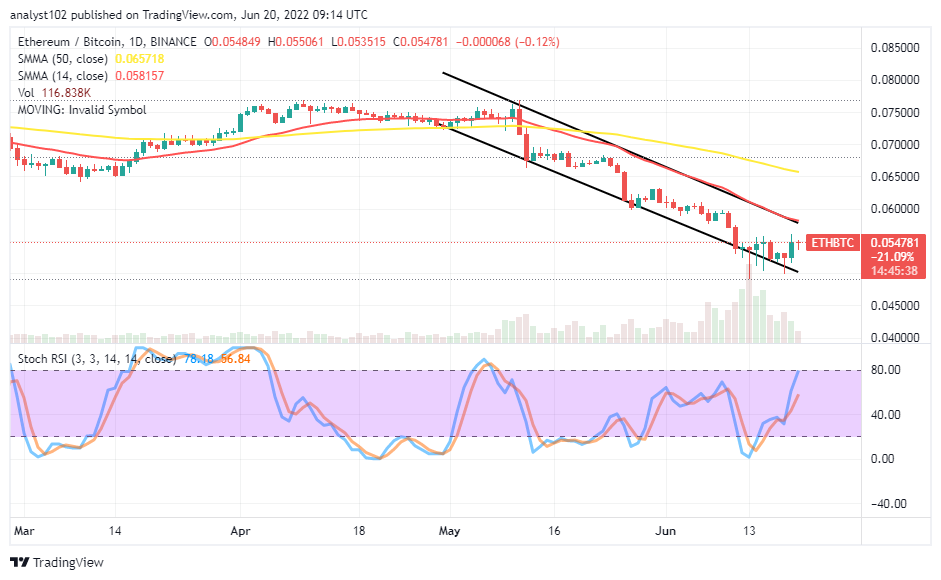
ETH/BTC Price Analysis
Ethereum’s trending ability against Bitcoin on the daily price chart reveals the base trading instrument has tried to swing northward from around the lower trend line. The cryptocurrency pair market builds energy from an in-depth lower-trading spot. And it is yet to give another bullish candlestick in today’s session to affirm a continuity in the sustainability of the current upward-moving motion to showcase the base crypto is recovering some strengths, pairing with its counter-trading crypto.
Note: Cryptosignals.org is not a financial advisor. Do your research before investing your funds in any financial asset or presented product or event. We are not responsible for your investing results.
“Lucky is up more than 50% today but still more than 430% from All Time Highs!
The opportunity to bank BIG is now!
You can purchase Lucky Block here. Buy LBlock