Ethereum (ETH/USD) Market Converges at $3,000
Estimated Reading Time: 3 minutes
Don’t invest unless you’re prepared to lose all the money you invest. This is a high-risk investment and you are unlikely to be protected if something goes wrong. Take 2 minutes to learn more
Ethereum Price Prediction – September 27
It observed that the ETH/USD market converges around the level of $3,000 heavily. Several attempts to push downward have been made by price. But, those attempts do not possess reliable momentum to the downside. Presently, the crypto trade gains a percentage rate of about 0.80, trading around the level of $3,086. That gives a sign that the market is in a relative increasing motion.
ETH/USD Market
Key Levels:
Resistance levels: $3,500, $3,750, $4,000
Support levels: $2,500, $2,250, $2,000
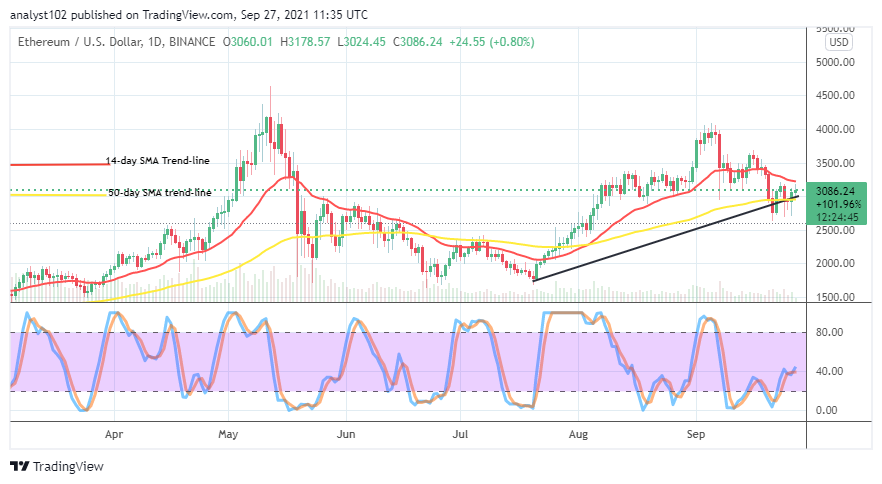
ETH/USD – Daily Chart
The ETH/USD daily chart reveals that the crypto market converges at $3,000 level as there have been more failing southward pushes than northward around the point. The 50-day SMA trend is around the area of price convergence at a high line. And, the bullish trend line drew in a supportive manner to the SMA indicator as the 14-day SMA indicator is above them, bending slightly to the south at a close range point. The Stochastic Oscillators are at the range of 40, trying to open the conjoined lines to the upside.
Will there be more downs beneath $3,000 as the market converges around it?
It would be more of a technical trading approach to await the subsequent price action around the $3,000 as the market converges around it presently. A retardation staging against the upswing of price around the trend line of the smaller SMA will possibly bring about the market line to experience a lowering motion. A decent long-position entry may have to feature after a while of price pulling-downs that, in the end, gets a spike from a low-trading spot.
On the downside, it still appears that some leftover selling pressures are between $3,500 and $3,000. A rare price forceful breakout at the higher value line will make the placing of selling orders uneasy afterward. As a result of that presumption, short-position takers will then have to patiently wait for the exhaustion of such presumed upward pressure if it will play out in accordance.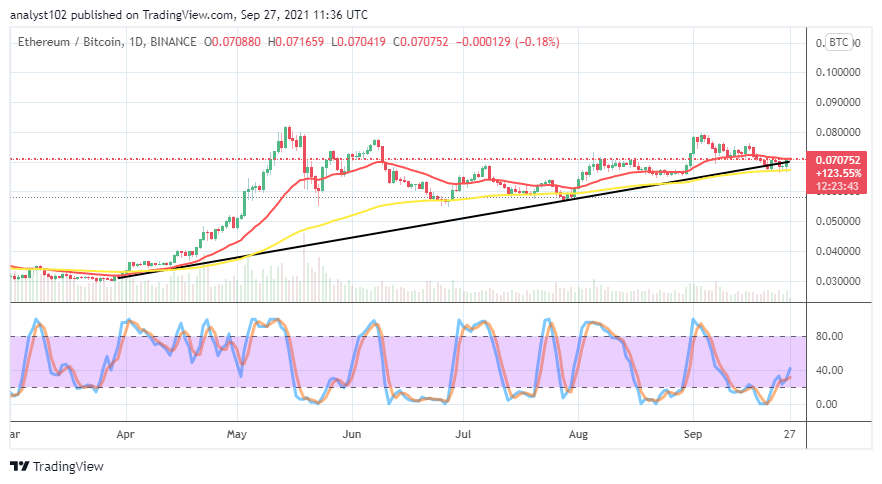
ETH/BTC Price Analysis
The ETH/BTC price analysis chart shows that the cryptocurrency pair market converges around a higher-low trading spot closely on the buy signal side of the bigger SMA trend line. The 14-day SMA indicator keeps a close-range position above the 50-day SMA indicator. And, they both are of north-pointing than the east. That indicates that the base crypto still possesses a greater chance of trending capability as paired with the flagship counter crypto. The Stochastic Oscillators have managed to move from the oversold region, briefly touch past the range of 40. That also added to the indication that ETH may soon enjoy a brighter chance to trend higher than Bitcoin in no time.
Note: Cryptosignals.org is not a financial advisor. Do your research before investing your funds in any financial asset or presented product or event. We are not responsible for your investing results.
You can purchase crypto coins here. Buy Tokens