Ethereum (ETH/USD) Market Converges near the Resistance Level of $220
Estimated Reading Time: 3 minutes
Don’t invest unless you’re prepared to lose all the money you invest. This is a high-risk investment and you are unlikely to be protected if something goes wrong. Take 2 minutes to learn more
Ethereum Price Prediction – April 12
There has been a line of price convergences in the market valuation of ETH/USD closely to the $220 resistance point from around April 2 until the present.
ETH/USD Market
Key Levels:
Resistance levels: $2,400, $2,600, $2,800
Support levels: $1,800, $1,600, $1,400
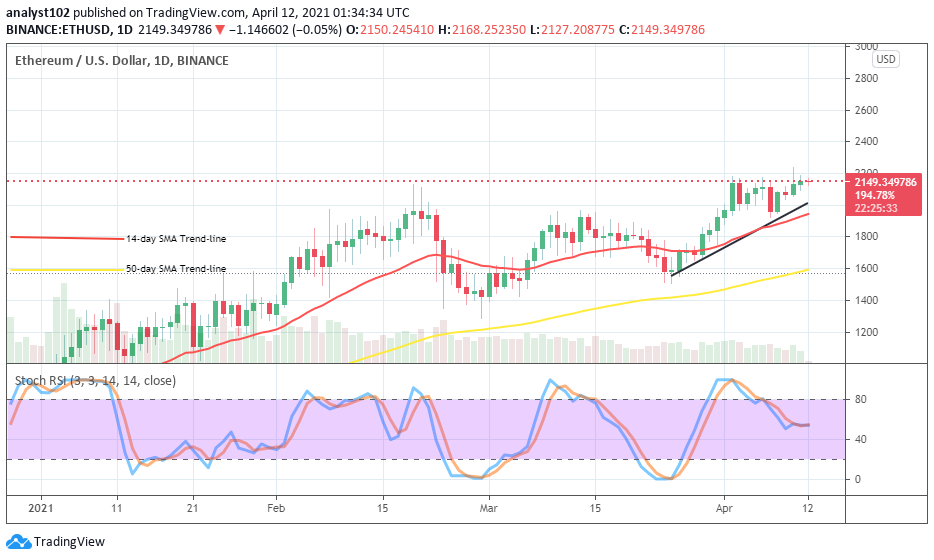
ETH/USD – Daily Chart
About a couple of trading days’ sessions, the ETH/USD daily chart has been witnessing an occurrence of variant candlesticks around the levels of $220 and $200. And, yet, the bullish trend-line and the 14-day SMA trend-line are both points to the north below the current trading line of the crypto-economy. The 50-day SMA indicator has touched the support line of $1,600 to also point to the north at that level from the below. The Stochastic Oscillators have slantingly traveled from the overbought region to place near range 40. They now closed the hairs in an attempt to signify a start of consolidation move around it. That indicates that the ETH/USD market northward moves are not yet fully exhausted.
Will the ETH/USD price soon breach northward past the $220 level?
An indication is still on a high note that in a near trading session, the ETH/USD bulls will garner more energy to surge further beyond the current main resistance level of $220. That said, the $200 line has to put on a watch note as a support line upon which the bulls have to muster the strength in continuation of their bullish trend away from the resistance trading line earlier stated.
As regards the downward technical analysis of this crypto-trade, the bears will still be having it not smooth especially if the present major resistance level of $220 is finally breached to the north. In that case, another selling entry will have to be awaited at a higher trading zone while price appears to get weak and, featuring a line of rejections with active moves before considering an entry.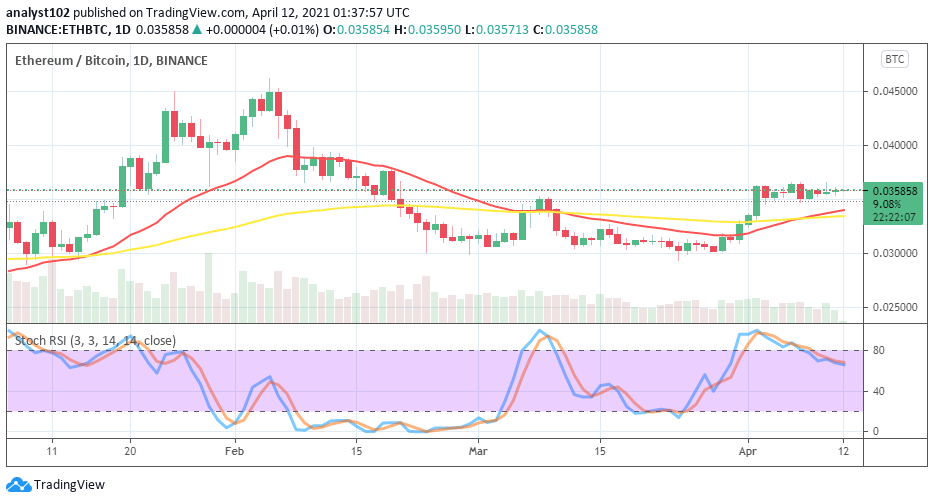
ETH/BTC Price Analysis
Taking a closer look at the degree of purchasing weight between the two most valued cryptocurrencies, ETH has only been managing to recover from pressures inflicted on it by BTC over time in the trading activities. At a lower-high zone, the base crypto has now entered a consolidation moving mode against the counter crypto. The 50-day SMA trend-line has been intercepted from the below by the 16-day SMA trading indicator. The stochastic Oscillators have slantingly placed a bit below range 80 from the overbought region. That signifies that there is an ongoing indecision trading situation in the crypto market.
Note: cryptosignals.org is not a financial advisor. Do your research before investing your funds in any financial asset or presented product or event. We are not responsible for your investing results.