Ethereum (ETH/USD) Market Dares, Touching $3,500 Level
Estimated Reading Time: 3 minutes
Don’t invest unless you’re prepared to lose all the money you invest. This is a high-risk investment and you are unlikely to be protected if something goes wrong. Take 2 minutes to learn more
Ethereum Price Prediction – October 5
It is on grand now that the ETH/USD market dares, touching the $3,500 level since the price has embarked upon a rallying move. The crypto-economic trading is observed at about 1.21 percent to trade around the market level of $3428.
ETH/USD Market
Key Levels:
Resistance levels: $3,750, $4,000, $4,250
Support levels: $3,000, $2,750, $2,500
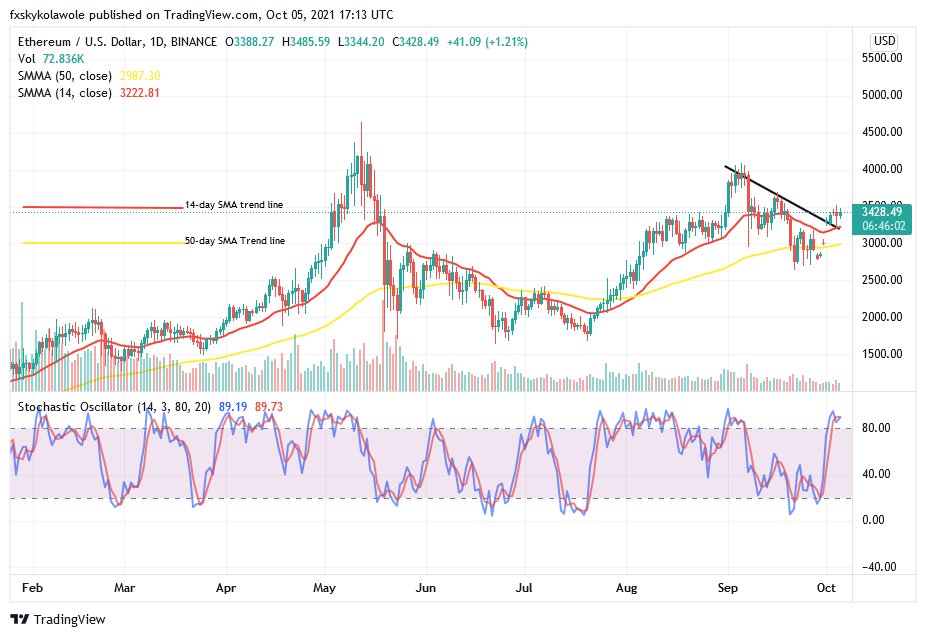
ETH/USD – Daily Chart
It is depicted on the ETH/USD daily chart that the crypto-economic market dares, touching the $3,500 level as there has been a trading sign of price rejections around the point. The 14-day SMA trend line has within the point earlier mentioned, and the $3,000 level bent slightly northward above the 50-day SMA trend line at the lesser value line, indicating a supportive trading role. The Stochastic Oscillators have penetrated the overbought region, suggesting that selling pressure may soon take over.
ETH/USD market dares, touching $3,500, will it breach the line northward in the subsequent sessions?
The expectation that the ETH/USD price valuation will get increased is on a gradual forthcoming note. In the meantime, some downs may feature in another round of correction to allow smooth up-swings after finding ideal support points in the process. At this point, the crypto market may experience some degrees of trading less-active situations around the level of $3,500 for a few hours or days.
On the downside, the $3,500 trading level now appears to be the vital point that the ETH/USD market bears will now have to breathe life back into their impact in the market. The current positioning of the 14-day SMA indicator suggests that the actual barrier trading line get a clear downward direction lies around $3,250. The point mentioned earlier will play a role in determining the real following market direction.
ETH/BTC Price Analysis
The ETH/BTC price analysis chart reveals that the duo-cryptocurrency market dares, touching the bigger SMA trend line yet in the process of a downward progression movement. The 14-day SMA indicator is over the 50-day SMA indicator as the bearish trend line systemically draws above them to showcase the posture pace of the price. The Stochastic Oscillators have crossed the lines southbound as the blue line has touched the range of 40. That denotes that the counter crypto is relatively pushing a bit higher against the valuation of the base crypto as of writing.
Note: Cryptosignals.org is not a financial advisor. Do your research before investing your funds in any financial asset or presented product or event. We are not responsible for your investing results.
You can purchase crypto coins here. Buy Tokens