Ethereum (ETH/USD) Market Experiences a Deeper Downturn
Estimated Reading Time: 3 minutes
Don’t invest unless you’re prepared to lose all the money you invest. This is a high-risk investment and you are unlikely to be protected if something goes wrong. Take 2 minutes to learn more

Free Crypto Signals Channel
Ethereum Price Prediction – May 9
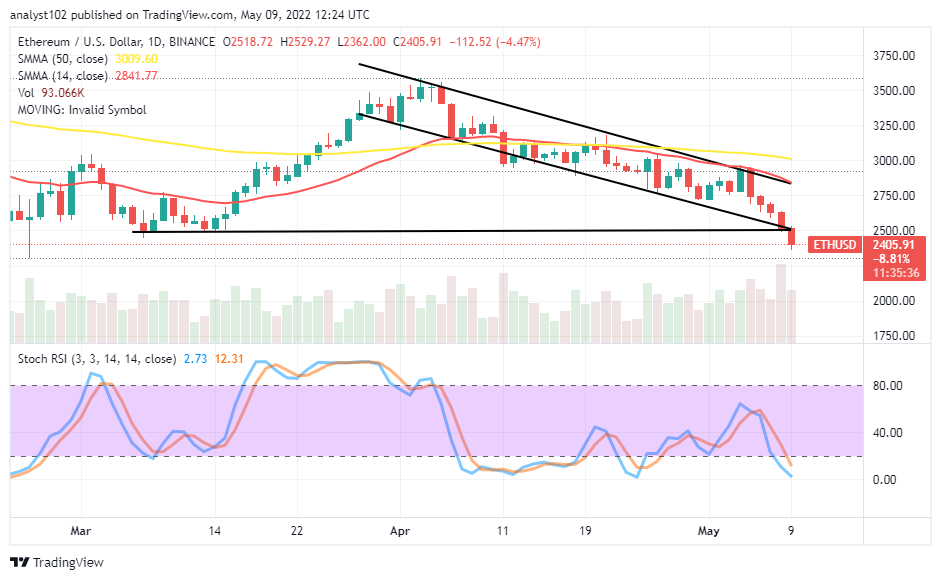
The ETH/USD market currently experiences a deeper downturn as the US currency forces the bullish pattern out of shape. The negativities on the market are estimated at an average of 4.47%, trading between $2,529 and 42,362 value lines.
ETH/USD Market
Key Levels:
Resistance levels: $2,500, $2,750, $3,000
Support levels: $2,250, $2,000, $1,750
ETH/USD – Daily Chart
The ETH/USD daily chart exhibits the crypto-economic market experiences a deeper downturn in its valuation as price breaches southward against the $2,500 trading line formerly serving as the point to a bullish trading pattern outlook. The positioning of the SMAs is far over the current trading spot as the 14-day SMA trend line is underneath the 50-day SMA trend line. The Stochastic oscillators are dipping their lines into the oversold region to indicate depression is still taking an active part in the crypto trading.
Will the ETH/USD market experience a deeper downturn furthermore?
As there has a record for the breaking down of the market at the $2,500 level, some more downs are liable to feature for a while in the ETH/USD trading operations. In the wake of the bulls’ readiness not to boost efforts to make a timely come-back above the $2,250 support level, some of the left-over downing forces beneath the value point mentioned earlier may be leveraged upon by bears to let there be a deeper downturn closely to the trading support line in the long run.
On the downside of the technical analysis, the ETH/USD market bears have to maintain stances below the $2,500 fresh resistance point over the long term by consolidating. A re-emergence of a bullish candlestick above the line will mean the crypto price will be getting set to reclaim parts of lost momentums subsequently. Sellers should wary of new positions placement below the present resistant trading line.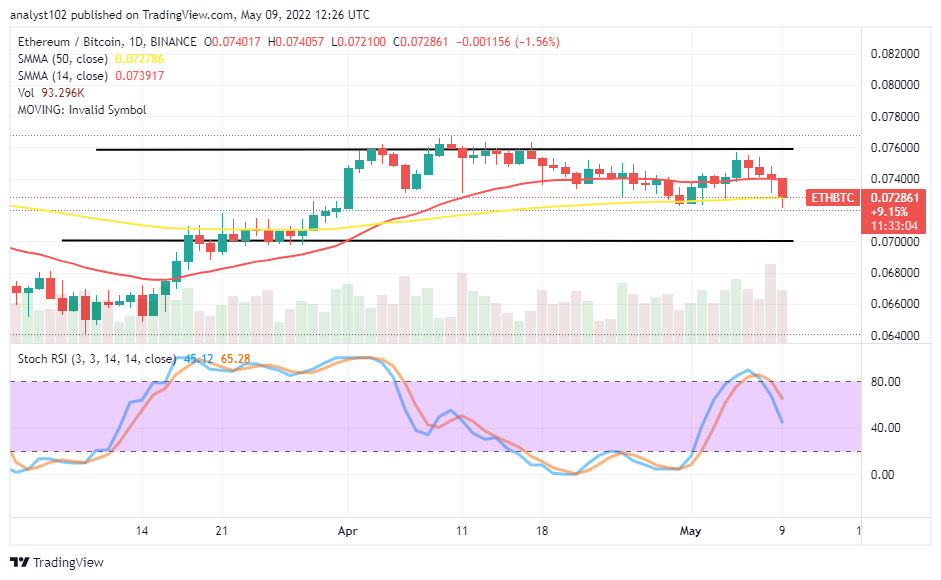
ETH/BTC Price Analysis
Ethereum’s trending capability continues to turn down with the countering force of Bitcoin within the range-bound settings. A deeper downturn can feature to signify a downward moving motion between the cryptocurrency pair market operations in the following sessions. The 14-day SMA indicator is above the 50-day SMA indicator. And they are in the range-bound trading zone. The Stochastic Oscillators have crossed southbound from the overbought region closer to the range of 40. That portends the base trading crypto is still under a falling mode pairing with the valuation of the counter crypto instrument.
Note: Cryptosignals.org is not a financial advisor. Do your research before investing your funds in any financial asset or presented product or event. We are not responsible for your investing results.
You can purchase Lucky Block here. Buy LBlock: